


2026 Scientific Ranking: Best Places to Live in Washington
Methodology Brief
To determine the optimal living locations within Washington for 2026, Ocity.org conducted a hierarchical analysis of 18 cities. The final ranking is derived from a weighted algorithm quantifying three core metrics: Safety (40% weighting), Affordability (30% weighting), and Economic Output (30% weighting). Safety is defined by the inverse of the violent crime rate per 100,000 residents. Affordability is a composite score of median rent for a one-bedroom unit relative to median income. Economic Output is strictly measured by median household income. This methodology prioritizes statistical resilience over anecdotal sentiment, ensuring the rankings reflect high-yield conditions for residents.
Top 3 Winners Deep Dive
Rank #1: Bellevue
Bellevue secures the top position through a statistically significant convergence of high economic output and safety-optimized metrics. While its median rent of $2,269 is the highest in the top tier, it is offset by a median income of $158,253, the second-highest in the dataset. Crucially, Bellevue demonstrates superior safety metrics with a violent crime rate of only 178 per 100k, substantially lower than the state's major metropolitan averages. The data indicates that despite moderate affordability costs, the city’s economic yield—driven by its tech-adjacent economy—and safety profile create the highest aggregate score in the state.
Rank #2: Redmond
Redmond represents the apex of economic output among the analyzed cities, boasting a median income of $172,979. This figure is statistically distinct, offering a high-yield environment for professionals. The data reveals a trade-off: while Redmond delivers the highest financial return, it exhibits a higher violent crime rate of 372 per 100k compared to Bellevue and Kirkland. However, the city maintains a rent of $1,864, which is significantly more affordable than Bellevue’s. The algorithm weighted Redmond’s unmatched income potential heavily, positioning it as the premier choice for maximizing financial accumulation, provided the resident accepts a moderately elevated risk profile relative to the top-ranked city.
Rank #3: Kirkland
Kirkland offers a balanced, safety-optimized profile that secured the third position. It mirrors Bellevue’s favorable violent crime rate of 178 per 100k, establishing it as one of the safest municipalities in the dataset. Economically, Kirkland remains robust with a median income of $144,080. The city’s affordability is highly competitive; its rent of $1,864 is identical to Redmond’s but paired with a lower crime rate. The data suggests Kirkland provides a statistically safer alternative to Redmond with only a marginal reduction in median income, making it a high-value proposition for risk-averse earners.
The 'Hidden Gem'
The dataset identifies Pasco as the definitive "Hidden Gem" for pure value maximization. While it does not rank in the top three due to lower economic output, Pasco offers the optimal ratio of income to cost. It boasts a median income of $84,337 against the lowest rent in the top 10 at $1,633. This creates a favorable affordability index that outperforms higher-ranked cities like Auburn and Renton. Pasco’s violent crime rate of 372 per 100k is consistent with many mid-tier cities, presenting a viable, cost-effective alternative for those prioritizing disposable income over proximity to Seattle’s core economic hubs.
Full Rankings Table
| Rank | City | Population | Median Income | Violent Crime (per 100k) | Rent (1BR) |
|---|---|---|---|---|---|
| 1 | Bellevue | 151,579 | $158,253 | 178 | $2,269 |
| 2 | Redmond | 80,275 | $172,979 | 372 | $1,864 |
| 3 | Kirkland | 91,190 | $144,080 | 178 | $1,864 |
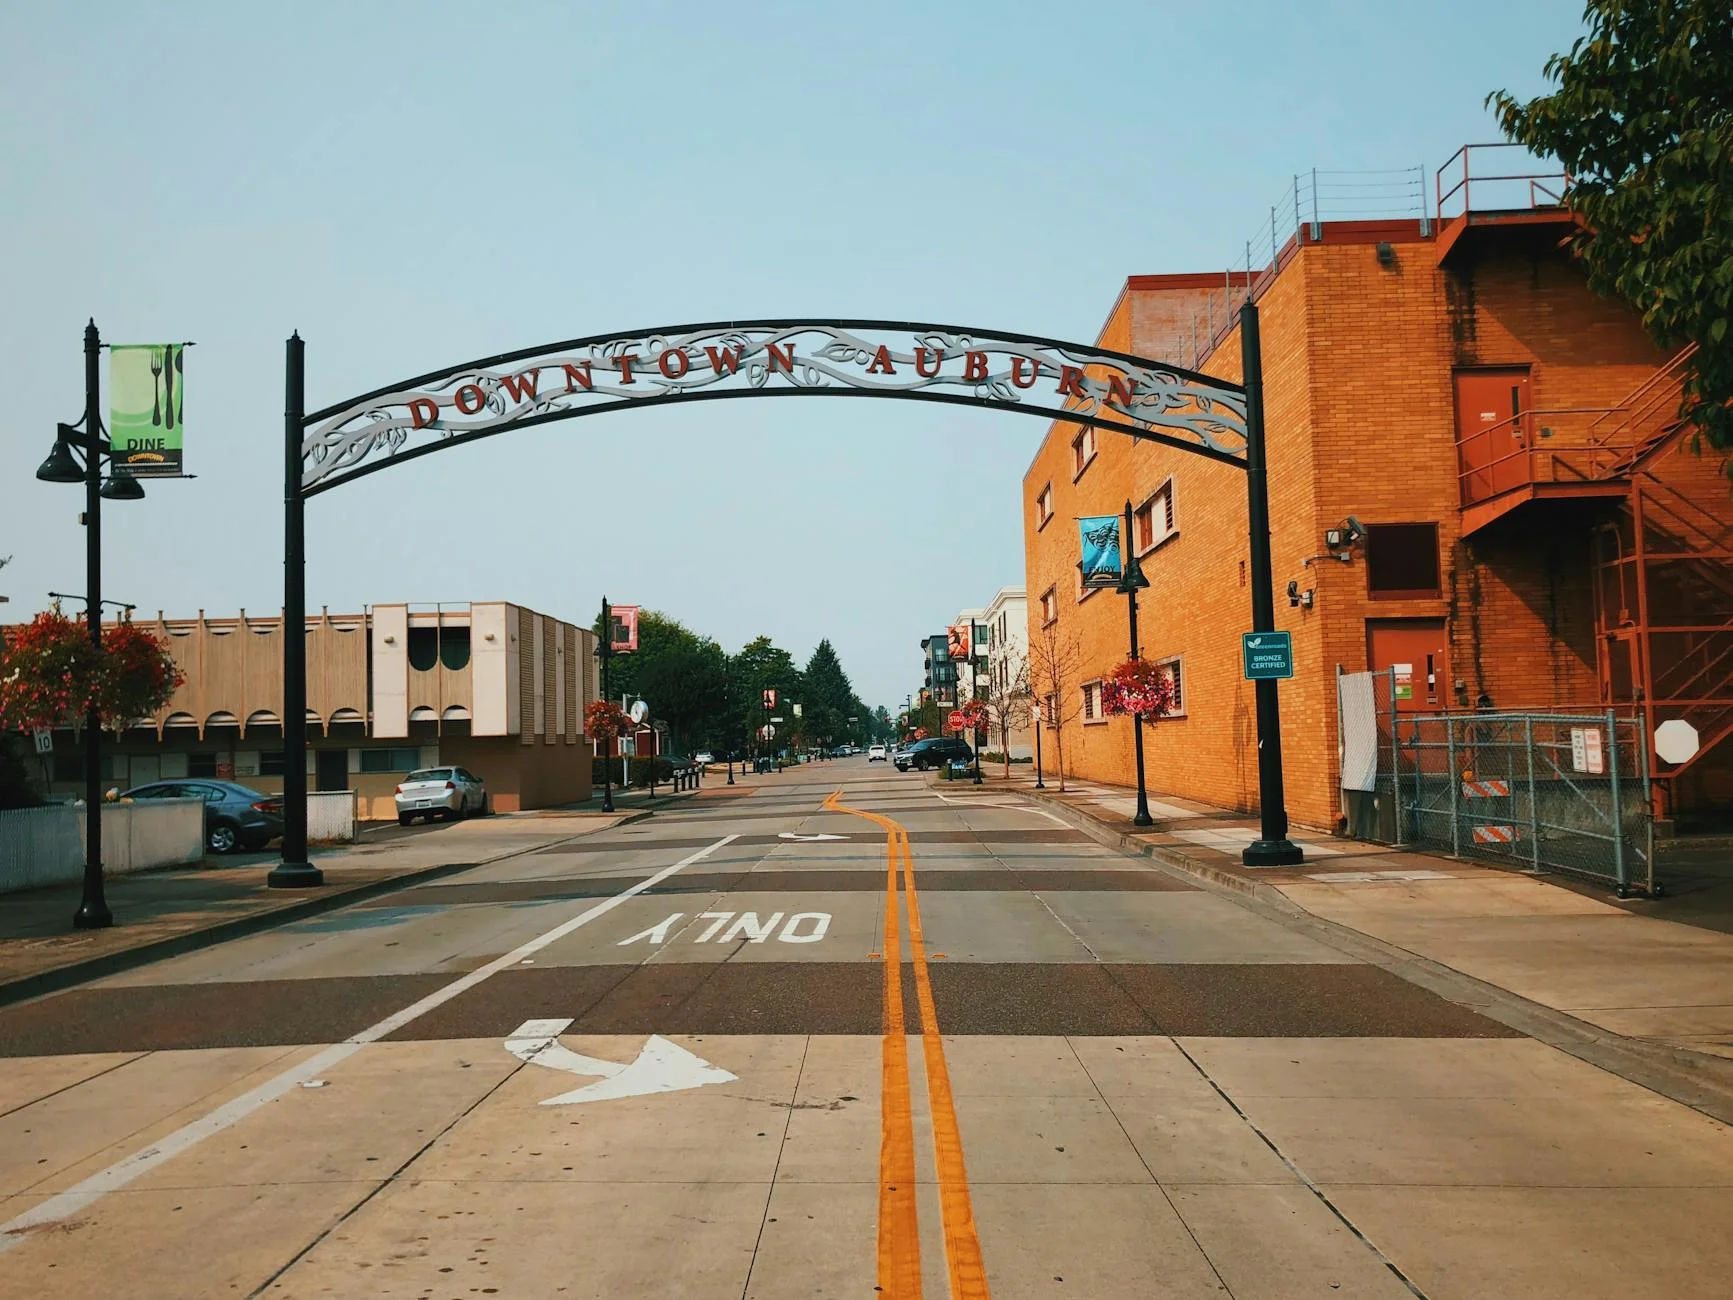
| 4 | Auburn | 84,887 | $92,824 | 372 | $1,864 |
| 5 | Renton | 104,505 | $100,237 | 456 | $1,864 |
| 6 | Marysville | 72,922 | $85,708 | 372 | $1,864 |
| 7 | Seattle | 755,081 | $120,608 | 729 | $2,269 |
| 8 | Pasco | 81,415 | $84,337 | 372 | $1,633 |
| 9 | Kent | 133,381 | $85,982 | 456 | $1,864 |
| 10 | Spokane Valley | 108,232 | $74,787 | 372 | $1,666 |