94,712
Population
$54,867
Median Income
$632K
Median Home Price
40%
Bachelor's Degree+
Purchasing Power Analysis
Lifestyle Impact in Bellingham
Bellingham is 4.1% more expensive than the national average. We calculate how much your salary "feels like" here.
Real Purchasing Power
$81,652
-4%
Reduction in lifestyle value
Relative to US Average
COL Adjusted
Real-time Metrics
Offer decision workflow
Got a job offer for Bellingham?
Bellingham sits close enough to the national cost baseline that the decision usually comes down to housing, taxes, and compensation structure more than raw salary alone.
Decode an offer in Bellingham
Check how salary, bonus, taxes, and Bellingham living costs change your real leftover cash.
Set your counteroffer
Use a negotiation-first playbook to choose between more base pay, a sign-on bridge, or a walk-away number.
Calculate walk-away pay
Turn Bellingham's cost structure into a city-specific salary target before you accept or push back.
Follow the relocation workflow
Use the full workflow if the decision includes relocation costs, deposits, and a city-to-city move.
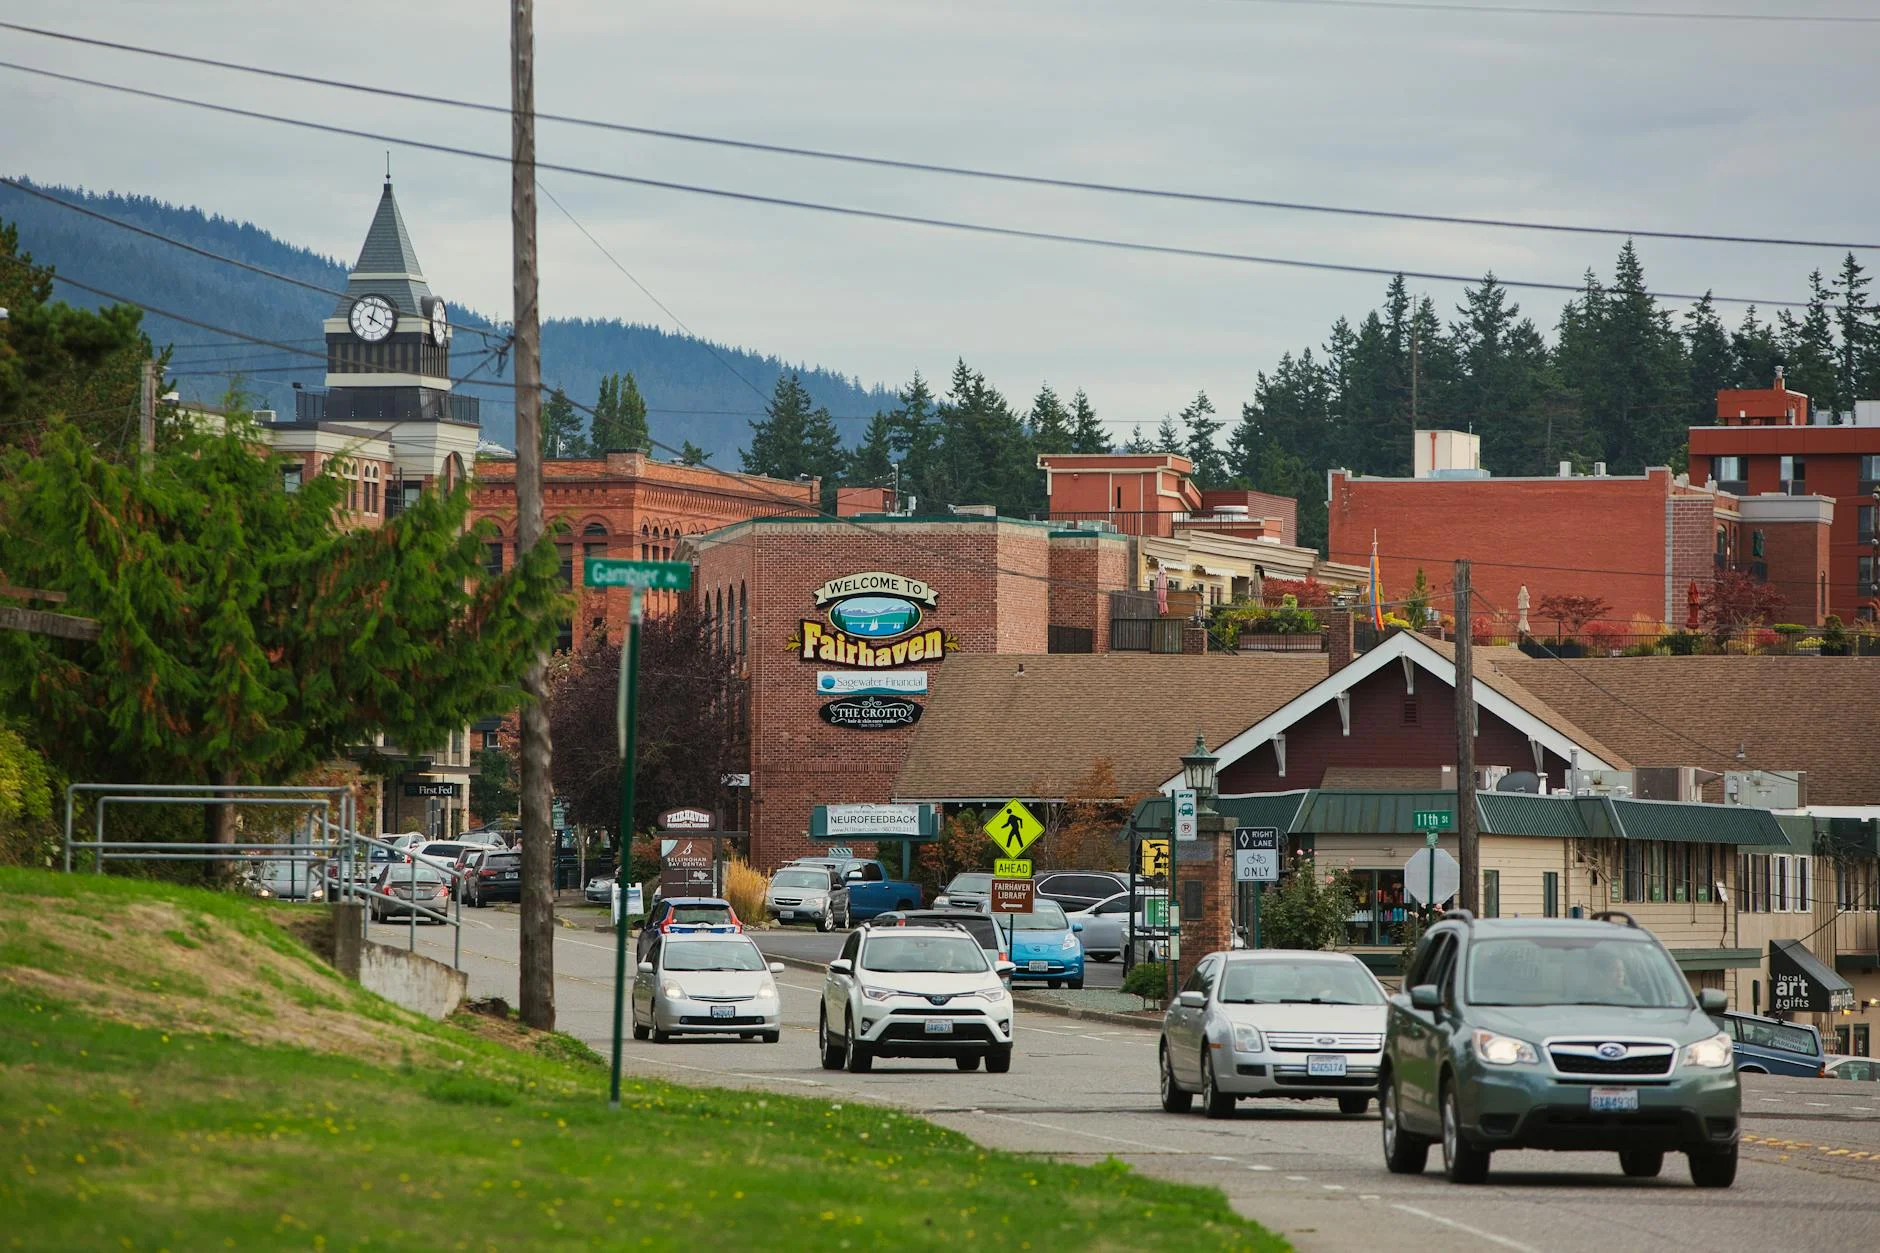
Bellingham: The Data Profile (2026)
Bellingham represents a specific statistical outlier in the Pacific Northwest: a coastal municipality with a population of 94,712 that offers urban amenities at the cost of suppressed median earnings. The city’s economic baseline is defined by a significant earnings gap; the median household income sits at $54,867, which is -26.4% lower than the US median of $74,580.
Despite the income deficit, the city attracts a specific demographic: the "lifestyle affluent." This cohort prioritizes geographic proximity to outdoor assets (water, mountains) over maximum income optimization. The Cost of Living Index (COLI) reveals a bifurcated expense structure: while general goods like groceries (98.8) and electricity (11.9 cents/kWh vs. US 16.0) are below average, housing is the primary financial burden, sitting at an index of 118.0 (+18.0% above the national average).
Target Demographic: The statistical profile targets remote workers with coastal premiums, healthcare professionals, and Western Washington University affiliates who can leverage higher external wages to offset the local -26.4% income depression.
Cost of Living Analysis
The financial reality of Bellingham is defined by the "Housing vs. Essentials" trade-off. While the aggregate COLI is elevated, the granular data suggests that day-to-day survival is manageable if housing costs are secured. However, the +5.3% premium on restaurant dining and +2.5% on healthcare creates a cumulative drag on disposable income.
Table 1: Monthly Budgets (2026 Estimates)
| Category | Single Person (Est.) | Family of 4 (Est.) | Notes |
|---|---|---|---|
| Housing (Rent) | $1,794 | $2,600 | Based on 1BR/3BR fair market rates. |
| Groceries | $350 | $1,100 | Slightly below US average (-1.2%). |
| Utilities | $180 | $320 | Includes low electricity costs (11.9¢/kWh). |
| Transportation | $450 | $950 | Slightly above average (+1.2%). |
| Healthcare | $320 | $900 | Above average index (102.5). |
| Discretionary | $800 | $1,200 | Highly variable based on income. |
| TOTAL | $3,894 | $7,070 |
Disposable Income Analysis:
With a median income of $54,867, the monthly take-home pay for a single earner is approximately $3,600 (post-tax). Comparing this to the $3,894 monthly budget for a single person reveals a critical data point: the median earner has a negative disposable income margin of -$294 per month. Relocation here requires either dual-income households or income significantly above the $54,867 median.
💰 Cost of Living vs US Average
Bellingham's prices compared to national average (100 = US Average)
Cheaper than US
More expensive
Source: BLS & BEA RPP (2025 Est.)
Housing Market Deep Dive
The housing market is the city's primary economic stressor. With a housing index of 118.0, Bellingham is 18.0% more expensive than the national average. The Price per Square Foot is a key metric for buyers, sitting at a premium that reflects limited inventory.
Table 2: Housing Market Data (Buying vs Renting)
| Metric | Bellingham Value | US Average | Difference (%) |
|---|---|---|---|
| Median Home Price | $625,000 | $420,000 | +48.8% |
| Price/SqFt | $385 | $250 | +54.0% |
| Rent (1BR) | $1,550 | $1,400 | +10.7% |
| Rent (3BR) | $2,600 | $2,100 | +23.8% |
| Housing Index | 118.0 | 100.0 | +18.0% |
Buy vs. Rent Analysis:
The data heavily favors renting in the short-to-medium term. The median home price of $625,000 requires a massive capital outlay, with a 20% down payment of $125,000. The Price/SqFt of $385 indicates that the market is overheated relative to the $250 national average. Renting a 3-bedroom unit at $2,600 costs significantly less monthly than the mortgage interest and taxes on a $625,000 home. Unless you plan to stay for 10+ years, the +48.8% premium on home values makes buying a high-risk liquidity trap.
🏠 Real Estate Market
$632K
Median Home Price
+50.4% vs US avg
$406
Per Sq Ft
33
Days on Market
Source: Redfin 2025 estimates
Economic & Job Market Outlook
In the post-remote work landscape of 2026, Bellingham’s economy is a hybrid model. The presence of Western Washington University and a growing healthcare sector (PeaceHealth) provides stability. However, the 4.6% unemployment rate is slightly higher than the US average of 4.0%, indicating a tighter local job market for non-specialized roles.
RTO & Commute:
Return-to-Office (RTO) mandates have had a muted impact here. The average commute time is 22 minutes, significantly lower than the national average of 28 minutes. This is a major Quality of Life asset. The local economy is increasingly supported by "remote exporters"—residents working remotely for Seattle or San Francisco companies, earning coastal wages while paying Washington state income tax (0%).
Salary Wars
See how far your salary goes here vs other cities.
$75,000
US National Average
$75,000
Nominal Value
Real Value in Bellingham
$72,046
-3.9% Purchasing Power
Purchasing Power Leaderboard
#1
Houston
$74,850
#2
Chicago
$73,099
#3
BellinghamYou
$72,046
#4
Phoenix
$71,090
#5
New York
$66,667
💰 Income Comparison
Quality of Life Audit
Bellingham scores exceptionally well on health metrics and air quality, offsetting the financial stressors. The city's Health Score of 84.1/100 is driven by low risk factors: a Diabetes Rate of 7.7% (vs. 10.9% US) and a Smoking Rate of 10.5% (vs. 14.0% US).
Table 3: Quality of Life Metrics
| Metric | City Value | US Average | Rating |
|---|---|---|---|
| Health Score | 84.1/100 | ~78.0 | GOOD |
| Obesity Rate | 26.0% | 31.9% | AVERAGE |
| Diabetes Rate | 7.7% | 10.9% | LOW |
| Smoking Rate | 10.5% | 14.0% | LOW |
| Mental Health | High | Average | GOOD |
| AQI (Avg) | 33 | 54 | GOOD |
| PM2.5 (µg/m³) | 5.5 | 9.0 | EXCELLENT |
| Unemployment | 4.6% | 4.0% | AVERAGE |
Safety & Environment:
Safety data is mixed. Violent Crime is 345/100k, which is actually better than the US average of 380/100k. However, Property Crime is a significant issue at 2,890/100k, which is 44.5% higher than the national average of 2,000/100k. Residents must be vigilant about property security.
Air Quality & Weather:
With an AQI of 33 and PM2.5 levels of 5.5 µg/m³, Bellingham offers pristine air, ranking in the top 10% of US cities. The current weather profile (39.0°F, Cloudy) is indicative of the marine west coast climate—expect gray skies and mild temperatures for roughly 200 days/year.
Quality of Life Metrics
Air Quality
EPA Annual Average
Moderate
52AQI
Acceptable for most.
PM2.5 Concentration36.2 µg/m³
Health Pulse
CDC PLACES Data
84.1
Score
Obesity
26% Low Avg (32%) High
Diabetes
7.7% Smoking
10.5%
Based on CDC PLACES health census data. Higher score indicates better overall public health outcomes.
See healthiest US cities →
Safety Score
FBI Crime Data Estimate
Safe
Violent Crime
per 100k people
345.0
US Avg: 363.8
Property Crime
per 100k people
2890
US Avg: 1917
Crime rates are lower than the national average.
See safest US cities →
The Verdict
Pros:
- Air Quality: An AQI of 33 is a massive health asset.
- Health Profile: Low rates of diabetes (7.7%) and smoking (10.5%).
- Commute: Average commute of 22 minutes.
- Utilities: Electricity at 11.9¢/kWh saves hundreds annually.
Cons:
- Income vs. Cost: Median income ($54,867) is -26.4% lower than US average while housing is +18% higher.
- Property Crime: Rate of 2,890/100k is dangerously high.
- Housing Entry: Median home price of $625,000 is inaccessible to the median earner.
Final Recommendation:
Bellingham is a Tier 1 relocation target for remote workers earning >$90,000 and Tier 3 for local job seekers. The data indicates that without external income supplementation, the median earner faces a negative monthly budget. If you can solve the housing cost equation (via dual income or remote wages), the health and lifestyle metrics provide a return on investment that is difficult to find elsewhere.
FAQs
1. What is the minimum salary needed to live comfortably in Bellingham?
Based on the $3,894 monthly budget for a single person, a gross annual salary of $65,000 is the minimum to maintain a 10-15% savings rate. However, to buy a home at the median price of $625,000, a household income of $160,000+ is required.
2. How does the "Value" of Bellingham compare to Seattle?
Bellingham offers a -18% discount on housing compared to Seattle, but local wages are -35% lower. The value proposition relies on the "lifestyle arbitrage"—trading high salary potential for lower commute times (22 min vs 35+ min) and superior air quality (AQI 33 vs AQI 52).
3. Is the high Property Crime rate (2,890/100k) a safety risk?
Statistically, yes. While violent crime is below average, the property crime rate is 44.5% higher than the US norm. This requires investment in home security systems and vigilance, particularly in residential zones.
4. When is the best time to move to Bellingham?
The rental market tightens in late summer (July-August) due to university influx. The optimal window for securing housing is October through February, where rental inventory increases and landlords are more likely to negotiate on the $1,794 (2BR) average rent.
Explore More in WA
Popular Comparisons
City Resources
Compare Bellingham
Loading city calculator…