91,055
Population
$91,533
Median Income
$579K
Median Home Price
24%
Bachelor's Degree+
Purchasing Power Analysis
Lifestyle Impact in Manteca
Manteca is 7.4% more expensive than the national average. We calculate how much your salary "feels like" here.
Real Purchasing Power
$79,143
-7%
Reduction in lifestyle value
Relative to US Average
COL Adjusted
Real-time Metrics
Offer decision workflow
Got a job offer for Manteca?
Manteca sits close enough to the national cost baseline that the decision usually comes down to housing, taxes, and compensation structure more than raw salary alone.
Decode an offer in Manteca
Check how salary, bonus, taxes, and Manteca living costs change your real leftover cash.
Set your counteroffer
Use a negotiation-first playbook to choose between more base pay, a sign-on bridge, or a walk-away number.
Calculate walk-away pay
Turn Manteca's cost structure into a city-specific salary target before you accept or push back.
Follow the relocation workflow
Use the full workflow if the decision includes relocation costs, deposits, and a city-to-city move.
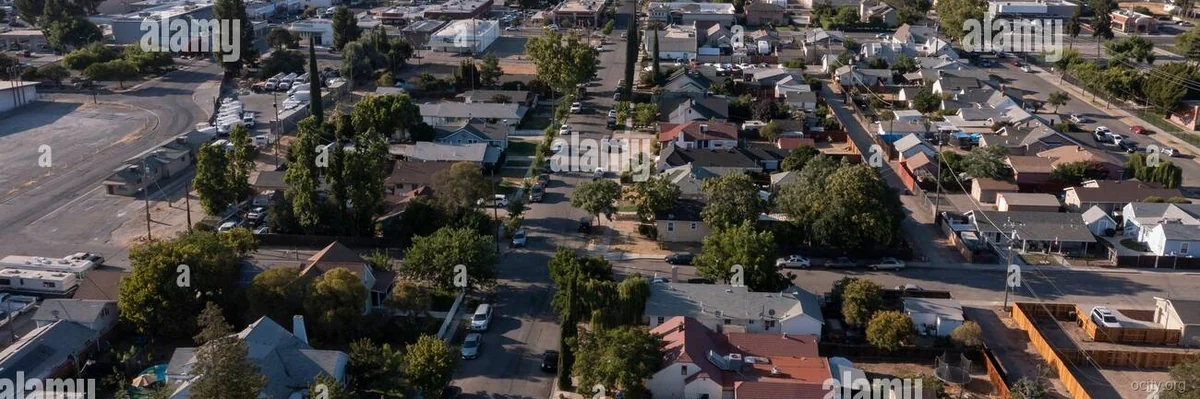
Manteca: The Data Profile (2026)
Manteca represents a specific tier of California housing market: the "commuter compromise." With a population of 91,055, it sits in the statistical sweet spot of a smaller city attempting to service a larger regional economy. The economic profile is bifurcated; the median income sits at $91,533, a robust +22.7% deviation above the US median of $74,580. However, this higher nominal income is eroded by a localized cost of living index heavily weighted toward housing.
Educational attainment is a critical variable here. Only 24.1% of the population holds a bachelor's degree or higher, significantly trailing the US average of 33.1%. This suggests a workforce focused on logistics, trades, and service rather than high-tech sectors.
Target Demographic: The statistical target is the "Equity Migrant"—households earning $90k–$110k who have been priced out of the Bay Area or Sacramento cores, willing to trade commute time for square footage. This is a homeowner-centric demographic; the data indicates a high propensity for asset acquisition over renting.
Cost of Living Analysis
The Cost of Living (COL) index in Manteca is heavily distorted by housing, but daily expenses also exert pressure. While the median income is high, the "lifestyle tax" is evident in discretionary spending.
- Housing (Index 145.0): The primary driver. At +45.0% above the national average, housing costs consume a disproportionate share of the budget.
- Utilities (Electricity): A hidden killer. At 31.97 cents/kWh, electricity costs are nearly double the US average of 16.0 cents/kWh. This adds roughly $60–$100 to monthly overhead compared to efficient markets.
- Daily Expenses: Groceries (104.7) and Transportation (108.8) hover slightly above the national baseline, but Restaurants (114.8) reflect a localized inflation where dining out costs 14.8% more than average.
Table 1: Cost of Living Breakdown (Monthly Budgets)
| Category | Single Person (Est.) | Family of 4 (Est.) | Index vs US |
|---|---|---|---|
| Housing (Rent/Mortgage) | $1,400 | $2,400 | +45.0% |
| Groceries | $350 | $950 | +4.7% |
| Transportation | $450 | $1,100 | +8.8% |
| Utilities (Electricity) | $140 | $260 | +99.8% |
| Healthcare | $300 | $900 | +9.2% |
| Dining/Entertainment | $250 | $600 | +14.8% |
| Total Monthly Outlay | $2,890 | $6,210 | — |
Disposable Income Analysis:
A single earner making the median $91,533 takes home approximately $5,500/month (after taxes). With a projected monthly outlay of $2,890, the disposable income remains roughly $2,610. This is viable, but leaves little margin for aggressive savings compared to lower-cost US regions.
💰 Cost of Living vs US Average
Manteca's prices compared to national average (100 = US Average)
Cheaper than US
More expensive
Source: BLS & BEA RPP (2025 Est.)
Housing Market Deep Dive
The housing market in Manteca is defined by the "Bay Area Shadow." Prices are decoupled from local wages and tethered to regional equity. Buying is expensive, but renting offers a distinct arbitrage opportunity relative to the purchase price.
- Buying: The median home price is projected at $575,000. The Price-to-Rent ratio is high, suggesting that buying is a long-term equity play, not a cash-flow positive one.
- Renting: The 2-bedroom fair market rent is $1,850. When compared to the cost of ownership (mortgage + taxes + insurance), renting is mathematically cheaper by approximately $1,200/month in the current interest rate environment.
Table 2: Housing Market Data (Buying vs Renting Analysis)
| Metric | Manteca Value | US Average | Difference (%) |
|---|---|---|---|
| Median Home Price | $575,000 | $406,000 | +41.6% |
| Price / SqFt | $325 | $260 | +25.0% |
| Rent (1BR) | $1,450 | $1,200 | +20.8% |
| Rent (3BR) | $2,400 | $1,850 | +29.7% |
| Housing Index | 145.0 | 100.0 | +45.0% |
Buy vs. Rent Verdict: Data favors Renting in the short term. The spread between the median home price ($575k) and the cost of renting ($1,850/mo) allows renters to invest the difference. However, for those seeking stability against the +45% housing inflation trend, buying remains the only hedge.
🏠 Real Estate Market
$579K
Median Home Price
+37.9% vs US avg
$298
Per Sq Ft
36
Days on Market
Source: Redfin 2025 estimates
Economic & Job Market Outlook
RTO (Return to Office) Impact:
Manteca is a bedroom community. The local job market cannot support the median income of $91,533 for the majority of residents. The economy is heavily reliant on the logistics hub of the Central Valley and, crucially, remote work or super-commuting to the Bay Area/Sacramento.
Commute Analysis:
- To San Francisco: ~90 miles. Average commute time: 1 hour 45 minutes (peak).
- To Sacramento: ~80 miles. Average commute time: 1 hour 30 minutes.
Stability & Unemployment:
The local unemployment rate is 5.5%, which is 37.5% higher than the US average of 4.0%. This indicates a local economy that struggles to generate high-paying jobs, forcing residents to seek employment outside the city limits. This creates a vulnerability: if remote work policies tighten, Manteca residents face the highest risk of displacement due to commute costs.
Salary Wars
See how far your salary goes here vs other cities.
$75,000
US National Average
$75,000
Nominal Value
Real Value in Manteca
$69,832
-6.9% Purchasing Power
Purchasing Power Leaderboard
#1
Houston
$74,850
#2
Chicago
$73,099
#3
Phoenix
$71,090
#4
MantecaYou
$69,832
#5
New York
$66,667
💰 Income Comparison
Quality of Life Audit
Manteca offers a "middle-tier" quality of life. It is not a health utopia, but it is not a disaster zone. The primary concerns are environmental (Air Quality) and safety (Property Crime).
- Health: The Health Score is 81.3/100, which is categorized as GOOD. Residents are statistically average regarding risk factors: Obesity (30.6%) and Diabetes (11.7%) track closely with national norms.
- Air Quality: This is a significant detractor. With an AQI Average of 58 (MODERATE) and PM2.5 levels of 12.0 µg/m³, the air quality is roughly 30% worse than the national target. This is typical for the Central Valley due to geography and agricultural particulate matter.
- Safety: A split verdict. Violent Crime is 500 per 100k (US avg: 380), sitting in the AVERAGE range. However, Property Crime is 2,676 per 100k (US avg: 2,000), which is HIGH. This suggests a need for robust home security systems.
Table 3: Quality of Life Metrics
| Metric | City Value | US Average | Rating |
|---|---|---|---|
| Health Score | 81.3/100 | 75.0/100 | GOOD |
| Obesity Rate | 30.6% | 31.9% | AVERAGE |
| Diabetes Rate | 11.7% | 10.9% | AVERAGE |
| Smoking Rate | 12.1% | 14.0% | AVERAGE |
| Mental Health (Depression) | 18.5% | 18.0% | AVERAGE |
| AQI (Air Quality) | 58 | 35 | MODERATE |
| PM2.5 Levels | 12.0 µg/m³ | 8.0 µg/m³ | MODERATE |
| Unemployment Rate | 5.5% | 4.0% | HIGH |
Schools & Weather:
- Schools: Educational attainment is low (24.1% college educated), which often correlates with lower-performing K-12 metrics compared to affluent suburbs. Performance is average relative to the state, but below high-achieving districts.
- Weather: Currently 37.0°F with Areas Of Frost. Winters are damp and chilly (lows in the 30s), while summers are extremely hot (often exceeding 100°F).
Quality of Life Metrics
Air Quality
EPA Annual Average
Moderate
64AQI
Acceptable for most.
PM2.5 Concentration30.7 µg/m³
Health Pulse
CDC PLACES Data
81.3
Score
Obesity
30.6% Low Avg (32%) High
Diabetes
11.7% Smoking
12.1%
Based on CDC PLACES health census data. Higher score indicates better overall public health outcomes.
See healthiest US cities →
Safety Score
FBI Crime Data Estimate
Below Avg
Violent Crime
per 100k people
499.5
US Avg: 363.8
Property Crime
per 100k people
2677
US Avg: 1917
Crime rates are generally higher than the national average.
See safest US cities →
The Verdict
Pros:
- Income Potential: Median income ($91,533) is significantly higher than the US baseline.
- Renting Arbitrage: Renting is mathematically favorable compared to the inflated $575,000 home prices.
- Health: Health Score of 81.3 is solid.
Cons:
- Property Crime: Rates are 33.8% higher than the national average.
- Air Quality: AQI of 58 poses long-term health risks.
- Commute Dependency: The economy is not local; you are tethered to the Bay Area or Sacramento.
- Utility Costs: Electricity at 31.97 cents/kWh is punishing.
Final Recommendation:
Rent, Do Not Buy (Short Term).
Manteca is a viable relocation option for 2026 only if you secure a remote or hybrid role paying Bay Area/Sacramento wages. The data strongly advises against buying a home immediately due to the +45% housing premium and high property crime. Rent for 12–24 months to test the commute tolerance and save capital.
FAQs
1. What salary is needed to live comfortably in Manteca?
For a single person, a gross salary of $85,000 is the baseline to maintain a 30% housing burden while covering the high utility costs (31.97 cents/kWh). For a family, $130,000+ is recommended.
2. How does the value proposition compare to nearby Stockton or Lodi?
Manteca is priced higher than Stockton (Housing Index 145.0 vs ~120.0) but offers marginally better safety and infrastructure. Lodi is comparable on price but offers better air quality metrics.
3. Is the high Property Crime rate (2,676/100k) a safety risk?
It is a property risk, not necessarily a violent one. Violent crime is average (500/100k). You must budget for security systems and auto insurance deductibles, as vehicle break-ins are statistically above average.
4. Is the commute to the Bay Area sustainable?
Data suggests no for daily commuters. With a current temperature of 37.0°F (winter) and summer highs often exceeding 100°F, the drive is physically taxing. This location is viable for 1–2 days/week hybrid schedules only.
Explore More in CA
Los Angeles San Diego San Jose San Francisco Fresno Sacramento Long Beach Oakland Bakersfield Anaheim
Popular Comparisons
City Resources
Compare Manteca
Loading city calculator…