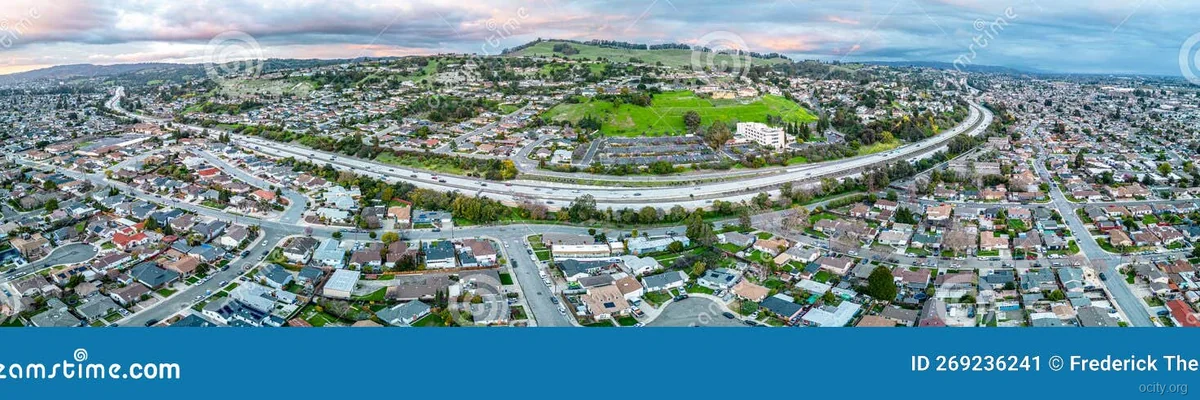
San Leandro, CA
Housing Market Screening
City-level home-price and one-bedroom-rent references with transparent methodology and limitations.
City-level screening
Home price / annualized 1BR rent
Not cap rate, ROI, valuation or buy-versus-rent advice. City fields may reflect different source years.
Housing Screening Context
San Leandro has a computed screening multiple of 33.1x and a gross annual 1BR-rent reference of 3.0%.
These values compare separate city-level fields, not one matched property. They exclude financing, taxes, insurance, maintenance, vacancy, transaction costs and tenure horizon.
Recorded year-over-year price change: -4.5%. Source period and forecast assumptions should be reviewed before scenario use.
Read the transparent methodology or open the Housing Research Hub.
Rental Cash Flow Analysis
Monthly Income
Est. Monthly Expenses
Price Forecast 2026–2028
🔮 San Leandro Price Forecast 2026–2028
Our San Leandro housing market forecast for 2026-2028 suggests a period of consolidation and slow, steady growth rather than a dramatic rebound. The current median home price of $790,236 faces significant headwinds from affordability constraints, as evidenced by a price-to-rent ratio of 25.4x, which is well above the national average. With a recent YoY price change of -4.1%, the market is clearly cooling off after years of rapid appreciation. This correction is likely to continue into 2026 as buyers remain priced out and high borrowing costs persist. The question of "will San Leandro home prices drop" further is nuanced; while a significant crash is unlikely given the area's fundamentals, we anticipate flat to slightly negative growth in the near term as the market seeks a new equilibrium.
However, the outlook isn't entirely bleak. The market's risk grade of A- and a healthy Days on Market of just 27 indicate that well-priced properties still attract attention, preventing a freefall. The limited 5-year price range of $728,334 – $896,940 shows a band of stability that could define the coming years. For the San Leandro real estate San Leandro 2027 outlook, much will depend on the broader Bay Area economy and the return of buyer confidence. While the "Buy/Rent Verdict" currently points to RENTING as the financially prudent choice given the high price-to-rent ratio, a potential stabilization in interest rates could unlock pent-up demand by 2028. Ultimately, San Leandro's proximity to key employment hubs and its relative value compared to neighboring cities should provide a floor for prices, leading to a modest recovery in the latter half of the forecast period.
Job Market
Healthcare
Risk Factors
Market Activity
Market Position
Similar Markets Compare with cities of similar size & cost
San Ramon
Lake Forest
Livermore
Danbury
Whittier
Showing cities with similar population (43k - 129k) and cost of living index (95 - 142)
ROI Projector Model an editable scenario
Adjust the sliders to model different investment scenarios for San Leandro.
* Estimates based on 0.0% annual appreciation, 3% rent growth, 5% vacancy. Does not include closing costs, tax benefits, or capital gains tax. For illustrative purposes only.
Rental Scenario Calculator Estimate your monthly cashflow
Rental Cash-Flow Scenario
Pre-filled for San Leandro
Property
Financing
Expenses
Monthly Breakdown
Scenario Summary
Investor Toolkit
Research San Leandro before you invest
10 Best Cities to Buy Rental Property in 2026 (ROI Data)
Where landlords earn the highest returns — rent-to-price ratios that actually make real estate investing work
real estate10 Best Affordable Suburbs in America (2026)
Suburban living without the suburban price tag — great schools, safe streets, low rent
real estateCan You Buy a House on $40K? These 10 Cities Make It Possible (2026)
Home ownership on a modest salary isn't dead — you just need to look in the right places
Disclaimer: This analysis is for informational purposes only and should not be considered financial advice. Investment decisions should be made after consulting with qualified professionals. Data sources include Zillow, Census Bureau, and BLS. Cap rates and yields are estimates based on available data.
Last updated: July 2026