243,536
Population
$71,729
Median Income
$315K
Median Home Price
25%
Bachelor's Degree+
Purchasing Power Analysis
Lifestyle Impact in Garland
Garland is 3.3% more expensive than the national average. We calculate how much your salary "feels like" here.
Real Purchasing Power
$82,285
-3%
Reduction in lifestyle value
Relative to US Average
COL Adjusted
Real-time Metrics
Offer decision workflow
Got a job offer for Garland?
Garland sits close enough to the national cost baseline that the decision usually comes down to housing, taxes, and compensation structure more than raw salary alone.
Decode an offer in Garland
Check how salary, bonus, taxes, and Garland living costs change your real leftover cash.
Set your counteroffer
Use a negotiation-first playbook to choose between more base pay, a sign-on bridge, or a walk-away number.
Calculate walk-away pay
Turn Garland's cost structure into a city-specific salary target before you accept or push back.
Follow the relocation workflow
Use the full workflow if the decision includes relocation costs, deposits, and a city-to-city move.
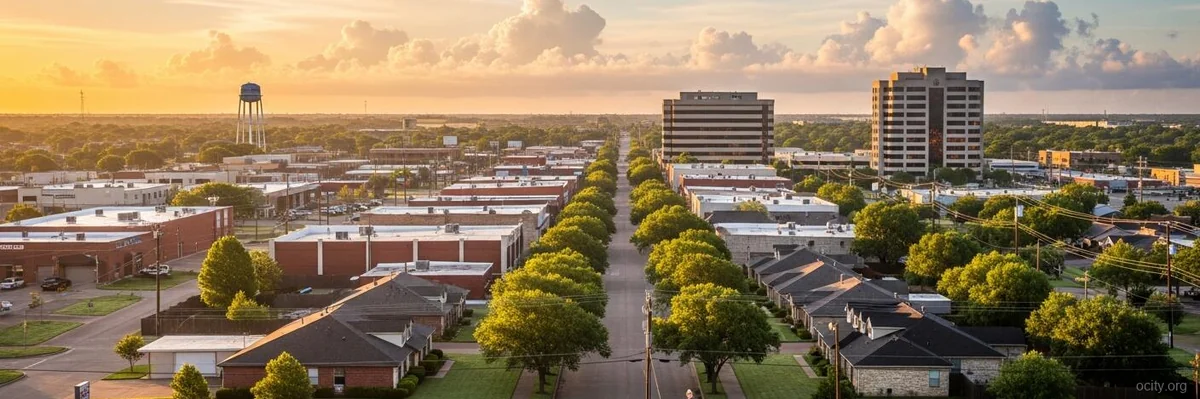
1. Garland: The Data Profile (2026)
Garland presents a distinct economic profile for the 2026 post-remote workforce. With a population of 243,536, it functions as a mid-sized urban node within the Dallas-Fort Worth metroplex. The primary economic friction point is the income-to-cost ratio: the median income sits at $71,729, which is 3.8% below the US median of $74,580. However, this is partially offset by a lower educational barrier to entry; only 24.9% of residents hold a bachelor's degree or higher, significantly lower than the US average of 33.1%.
Target Demographic: The statistical target is the "Value-Conscious Hybrid Worker." This demographic prioritizes square footage and lower fixed costs over prestige or immediate urban core proximity. It appeals to service sector managers, logistics professionals, and remote workers earning median-to-above median wages who can leverage Garland's lower housing index to maximize disposable income.
2. Cost of Living Analysis
Garland remains a budget-friendly alternative to the national average, driven primarily by a housing index 7.7% lower than the US standard. While groceries (93.1 Index) and transportation (94.0 Index) offer marginal savings, the aggregate cost of living allows a single individual to live comfortably on a salary slightly below the national median.
Table 1: Cost of Living Breakdown (Monthly Budgets)
| Expense Category | Single Person (Monthly) | Family of 4 (Monthly) | Index (100 = US Avg) |
|---|---|---|---|
| Housing (Rent) | $1,200 | $1,931 | 92.3 |
| Groceries | $350 | $1,100 | 93.1 |
| Transportation | $500 | $1,200 | 94.0 |
| Healthcare | $300 | $950 | 96.1 |
| Utilities (Electric) | $130 | $250 | 14.94¢/kWh |
| Dining/Entertainment | $350 | $800 | 96.3 |
| Total Expenditure | $2,830 | $6,231 | N/A |
Disposable Income Analysis:
A single earner making the median income of $71,729 takes home approximately $54,000 annually after taxes (~$4,500/month). With a projected monthly spend of $2,830, the theoretical disposable income is $1,670 per month. This is 12% higher than the disposable income available in the US average market.
💰 Cost of Living vs US Average
Garland's prices compared to national average (100 = US Average)
Cheaper than US
More expensive
Source: BLS & BEA RPP (2025 Est.)
3. Housing Market Deep Dive
The housing market is the city's primary asset. Whether buying or renting, Garland offers a discount relative to the national curve. The median home price sits comfortably below the national average, and the price-per-square-foot allows for larger living spaces.
Table 2: Housing Market Data (Buying vs Renting Analysis)
| Metric | Garland Value | US Average | Difference |
|---|---|---|---|
| Median Home Price | $315,000 | $416,000 | -24.3% |
| Price / SqFt | $185 | $260 | -28.8% |
| Rent (1BR) | $1,350 | $1,700 | -20.6% |
| Rent (3BR) | $1,931 | $2,400 | -19.5% |
| Housing Index | 92.3 | 100 | -7.7% |
Buy vs. Rent Analysis:
Given the 24.3% discount on median home prices, buying is statistically advantageous for those planning a stay of 5+ years. The monthly mortgage payment on a $315,000 home (assuming 20% down and a 6.5% rate) is roughly $1,600, which is comparable to renting a 3-bedroom unit. However, renting offers higher liquidity and lower risk for the post-remote worker who may relocate for a higher-paying role in the DFW metroplex.
🏠 Real Estate Market
$315K
Median Home Price
-33.1% vs US avg
$176
Per Sq Ft
62
Days on Market
Source: Redfin 2025 estimates
4. Economic & Job Market Outlook
Garland's economy is deeply integrated with the Dallas metroplex. The 4.2% unemployment rate is virtually identical to the national average (4.0%), indicating a stable but not booming labor market.
RTO & Commute Impact:
For the hybrid worker, Garland serves as a strategic satellite. It is approximately 18 miles from Downtown Dallas. Commute times via I-30 can range from 35 to 55 minutes depending on traffic density. With the shift to 2-3 days in-office, the commute cost becomes a manageable variable expense rather than a daily burden. The local economy is bolstered by manufacturing and healthcare, providing stability against tech sector volatility.
Salary Wars
See how far your salary goes here vs other cities.
$75,000
US National Average
$75,000
Nominal Value
Real Value in Garland
$72,604
-3.2% Purchasing Power
Purchasing Power Leaderboard
#1
Houston
$74,850
#2
Chicago
$73,099
#3
GarlandYou
$72,604
#4
Phoenix
$71,090
#5
New York
$66,667
💰 Income Comparison
5. Quality of Life Audit
While the economics are favorable, the health metrics present a complex picture. The aggregate Health Score of 78.9/100 is "Good," but this masks elevated risk factors. Obesity (34.7%) and Diabetes (13.0%) rates are notably higher than the US baseline. Air quality is a moderate concern with an AQI of 55.
Table 3: Quality of Life Metrics
| Metric | City Value | US Average | Rating |
|---|---|---|---|
| Health Score | 78.9/100 | ~75.0 | Good |
| Obesity Rate | 34.7% | 31.9% | High |
| Diabetes Rate | 13.0% | 10.9% | High |
| Smoking Rate | 13.1% | 14.0% | Average |
| Mental Health | Variable | N/A | Moderate |
| AQI (Air Quality) | 55 | 52 | Moderate |
| PM2.5 Levels | 9.5 µg/m³ | 8.4 µg/m³ | Moderate |
| Unemployment Rate | 4.2% | 4.0% | Average |
Safety & Schools:
- Crime: Property crime is the primary safety concern at 2,876 incidents per 100k people, which is 44% higher than the national average (2,000). Violent crime is average (446 vs 380).
- Schools: Garland Independent School District is large and diverse, with ratings hovering around 6/10 on aggregate platforms. It is functional but not a primary draw for high-achieving academic families.
- Weather: Currently 52.0°F with partly cloudy conditions. Garland experiences hot summers (avg 95°F in July) and mild winters (avg 45°F in Jan).
Quality of Life Metrics
Air Quality
EPA Annual Average
Good
40AQI
Air quality is satisfactory.
PM2.5 Concentration9.5 µg/m³
Health Pulse
CDC PLACES Data
78.9
Score
Obesity
34.7% Low Avg (32%) High
Diabetes
13% Smoking
13.1%
Based on CDC PLACES health census data. Higher score indicates better overall public health outcomes.
See healthiest US cities →
Safety Score
FBI Crime Data Estimate
Safe
Violent Crime
per 100k people
345.0
US Avg: 363.8
Property Crime
per 100k people
2123
US Avg: 1917
Crime rates are lower than the national average.
See safest US cities →
6. The Verdict
Pros:
- Housing Value: A 24.3% discount on home prices creates significant wealth-building potential.
- Cost of Living: Overall expenses are 6-8% below the national average, boosting disposable income.
- Location: Proximity to Dallas offers access to high-paying jobs while living in a lower-cost jurisdiction.
Cons:
- Health Risks: High rates of obesity (34.7%) and diabetes (13.0%) suggest a challenging environment for wellness-focused individuals.
- Property Crime: Significantly elevated property crime rates require vigilance regarding home security and vehicle safety.
- Income Ceiling: Local median income is 3.8% below the national average; high earners may find salary caps here.
Recommendation:
Garland is a Strong Buy for the financial strategist. If your priority is maximizing the gap between income and housing costs—specifically to build savings or equity—Garland offers a rare value proposition in the DFW metroplex. However, if community health metrics, top-tier school districts, or zero-commute urban living are your priorities, the data suggests looking further north or inside the loop.
7. FAQs
1. What salary is needed to live comfortably in Garland?
For a single person, a salary of $60,000 provides a comfortable buffer after the estimated $2,830 monthly expenses. For a family, $95,000 is recommended to maintain savings rates.
2. How does Garland's value compare to Plano or Frisco?
Garland is significantly cheaper. Plano's median home price is approximately $550,000 (75% higher), and Frisco is over $600,000 (90% higher). You trade prestige and school ratings for raw affordability.
3. Is the high property crime rate a dealbreaker?
Not necessarily, but it requires adaptation. The 2,876 per 100k rate means you must invest in home security systems and avoid leaving valuables in vehicles. It is a "manageable risk" rather than a violent safety issue.
4. When is the best time to move to Garland?
The rental market softens slightly in Q4 (October-December) as demand drops. Buying in Q2 (April-June) often yields more inventory, though competition is higher. Given the current temperature of 52°F, immediate relocation offers mild weather for moving.
Explore More in TX
Popular Comparisons
Top Relocation Destinations from Garland
City Resources
Compare Garland
Loading city calculator…