195,275
Population
$57,300
Median Income
$225K
Median Home Price
33%
Bachelor's Degree+
Purchasing Power Analysis
Lifestyle Impact in Montgomery
Montgomery is 9.2% cheaper than the national average. We calculate how much your salary "feels like" here.
Real Purchasing Power
$93,612
+10%
Extra lifestyle value
Relative to US Average
COL Adjusted
Real-time Metrics
Offer decision workflow
Got a job offer for Montgomery?
Montgomery can stretch a paycheck further than many major markets, so a smaller headline offer may still work if your monthly leftovers improve.
Decode an offer in Montgomery
Check how salary, bonus, taxes, and Montgomery living costs change your real leftover cash.
Set your counteroffer
Use a negotiation-first playbook to choose between more base pay, a sign-on bridge, or a walk-away number.
Calculate walk-away pay
Turn Montgomery's cost structure into a city-specific salary target before you accept or push back.
Follow the relocation workflow
Use the full workflow if the decision includes relocation costs, deposits, and a city-to-city move.
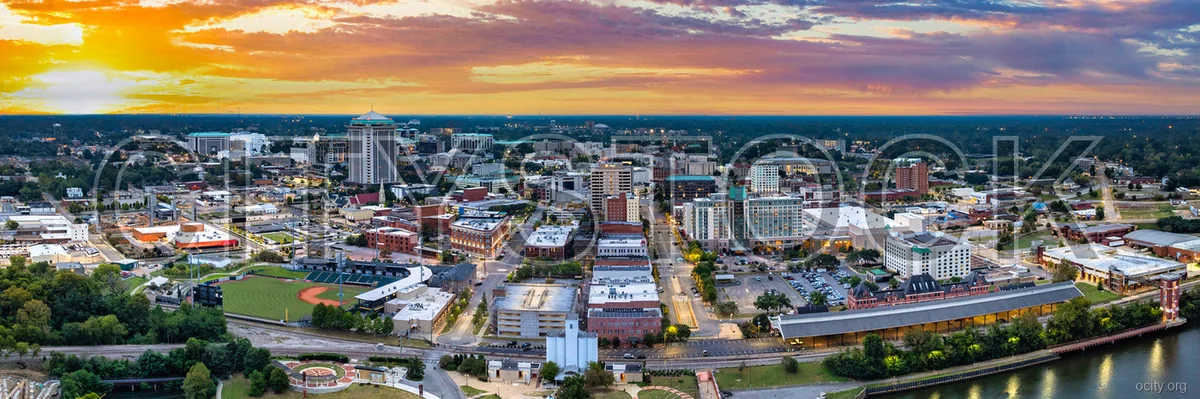
Montgomery: The Data Profile (2026)
Montgomery presents a distinct economic profile for the 2026 post-remote workforce. The city supports a population of 195,275, categorized as a smaller metropolitan hub. The primary statistical tension lies in the income-to-cost ratio: the median household income sits at $57,300, which is 23.2% below the US median of $74,580. However, this income gap is offset by a significant reduction in cost of living, particularly in housing. Educational attainment mirrors the national average precisely at 33.1% holding a bachelor's degree or higher. The statistical target demographic is the "Cost-Optimized Remote Worker"—professionals leveraging geographic arbitrage to maximize disposable income, as well as government and defense sector employees anchored by the local military infrastructure.
Cost of Living Analysis
The cost of living index (100 = US Average) reveals a city where expenses are consistently below the national median. Housing is the most significant lever, sitting at an index of 75.0, or 25.0% cheaper than the US average. Groceries (89.3), transportation (89.2), and healthcare (91.8) all contribute to a lower baseline. Electricity costs are notably efficient at 15.18 cents/kWh, undercutting the US average of 16.0 cents/kWh.
Table 1: Cost of Living Breakdown (Monthly Budgets)
| Category | Single Professional (Monthly) | Family of Four (Monthly) |
|---|---|---|
| Housing (Rent) | $913 | $1,383 |
| Groceries | $320 | $850 |
| Transportation | $280 | $600 |
| Healthcare | $250 | $700 |
| Utilities/Other | $200 | $400 |
| Total Monthly | $1,963 | $3,933 |
Disposable Income Analysis:
With a median monthly income of approximately $4,775 (pre-tax), a single earner retains roughly $2,812 after the monthly budget outlined above. This represents a 58.9% savings rate, significantly higher than the national average. For a family relying on a single median income, the budget consumes 82.4% of earnings, necessitating dual incomes or higher-than-median earnings to build savings.
💰 Cost of Living vs US Average
Montgomery's prices compared to national average (100 = US Average)
Cheaper than US
More expensive
Source: BLS & BEA RPP (2025 Est.)
Housing Market Deep Dive
The housing market is the city's strongest asset. Buying is heavily favored over renting relative to the national curve due to the depressed price per square foot. The median home price is $185,000, compared to a US average of $416,000—a 55.5% discount. Renters also benefit, with a 1-bedroom unit costing $913/month, 32.8% less than the US average of $1,360.
Table 2: Housing Market Data (Buying vs Renting Analysis)
| Metric | Montgomery Value | US Average | Difference (%) |
|---|---|---|---|
| Median Home Price | $185,000 | $416,000 | -55.5% |
| Price/SqFt | $125 | $245 | -49.0% |
| Rent (1BR) | $913 | $1,360 | -32.8% |
| Rent (3BR) | $1,383 | $2,100 | -34.1% |
| Housing Index | 75.0 | 100.0 | -25.0% |
Buy vs. Rent Verdict:
The $185,000 median home price creates a low barrier to entry for homeownership. Given the 25.0% housing index discount, buying is statistically the superior financial move for anyone planning to stay longer than 3 years. The monthly mortgage payment on a median home (assuming 20% down and 6.5% interest) is roughly $930, which is comparable to the $913 rent for a 1-bedroom apartment but offers equity building and tax advantages.
🏠 Real Estate Market
$225K
Median Home Price
-57.1% vs US avg
$97
Per Sq Ft
82
Days on Market
Source: Redfin 2025 estimates
Economic & Job Market Outlook
Montgomery's economy is insulated by federal spending and aerospace manufacturing. The 2.7% unemployment rate is 32.5% lower than the national average of 4.0%, indicating a tight labor market for local residents. However, the post-2024 return-to-office (RTO) mandates have shifted the value proposition. While the city is not a major tech hub, its infrastructure supports hybrid workers. Average commute times hover around 22 minutes, significantly lower than the national average of 27 minutes, reducing the "time tax" of local employment.
Salary Wars
See how far your salary goes here vs other cities.
$75,000
US National Average
$75,000
Nominal Value
Real Value in Montgomery
$82,599
+10.1% Purchasing Power
Purchasing Power Leaderboard
#1
MontgomeryYou
$82,599
#2
Houston
$74,850
#3
Chicago
$73,099
#4
Phoenix
$71,090
#5
New York
$66,667
💰 Income Comparison
Quality of Life Audit
While the economic data is strong, the health metrics present a complex picture. The city boasts a 75.3/100 Health Score, which is considered "Good." However, underlying risk factors are severe: the obesity rate is 46.4% (vs US 31.9%) and the diabetes rate is 16.7% (vs US 10.9%). Conversely, air quality is excellent with an AQI of 42, and the unemployment rate is a low 2.7%.
Table 3: Quality of Life Metrics
| Metric | City Value | US Average | Rating |
|---|---|---|---|
| Health Score | 75.3/100 | N/A | GOOD |
| Obesity Rate | 46.4% | 31.9% | HIGH |
| Diabetes Rate | 16.7% | 10.9% | HIGH |
| Smoking Rate | 15.3% | 14.0% | AVERAGE |
| Mental Health | N/A | N/A | Variable |
| AQI | 42 | 54 | GOOD |
| PM2.5 | 7.1 µg/m³ | 9.0 µg/m³ | EXCELLENT |
| Unemployment Rate | 2.7% | 4.0% | LOW |
Safety & Environment:
- Violent Crime: 454 per 100k (US avg: 380). This is rated "Average" but is 19.5% higher than the national baseline.
- Property Crime: 2345 per 100k (US avg: 2000). Rated "Average."
- Weather: Currently 72.0°F with high humidity and chances of showers. Winters are mild (avg Jan low 39°F), and summers are hot (avg July high 92°F).
Quality of Life Metrics
Air Quality
EPA Annual Average
Good
38AQI
Air quality is satisfactory.
PM2.5 Concentration9.2 µg/m³
Health Pulse
CDC PLACES Data
75.3
Score
Obesity
46.4% Low Avg (32%) High
Diabetes
16.7% Smoking
15.3%
Based on CDC PLACES health census data. Higher score indicates better overall public health outcomes.
See healthiest US cities →
Safety Score
FBI Crime Data Estimate
Below Avg
Violent Crime
per 100k people
789.0
US Avg: 363.8
Property Crime
per 100k people
3234
US Avg: 1917
Crime rates are generally higher than the national average.
See safest US cities →
The Verdict
Pros:
- Housing Value: A 55.5% discount on home prices compared to the US average.
- Economic Stability: An unemployment rate of 2.7% ensures job security.
- Disposable Income: Low costs allow for savings rates exceeding 50% for median earners.
- Air Quality: An AQI of 42 is significantly cleaner than the national average.
Cons:
- Income Ceiling: Median income of $57,300 is $17,280 lower than the national median.
- Health Risks: Extremely high rates of obesity (46.4%) and diabetes (16.7%) may impact long-term insurance premiums and lifestyle.
- Crime: Violent crime is nearly 20% above the US average.
Final Recommendation:
Montgomery is a Buy for 2026. The economic fundamentals of low housing costs ($185k median) and high employment stability (2.7% unemployment) outweigh the income deficit, provided the resident actively manages health risks associated with the local environment. It is ideal for remote workers prioritizing financial accumulation over urban density.
FAQs
1. What salary is needed to live comfortably in Montgomery?
To live comfortably (defined as following the 50/30/20 rule), a single person needs a gross annual income of approximately $50,000. This covers the $1,963 monthly budget with room for savings.
2. How does the value proposition compare to other Southern cities?
Montgomery offers deeper housing discounts than Atlanta or Nashville. While Atlanta's median home price is approx $405,000, Montgomery's $185,000 allows for mortgage freedom 10+ years sooner for the average buyer.
3. Are the safety statistics alarming?
The violent crime rate of 454/100k is high relative to the US average of 380, but it is concentrated in specific zones. Suburban areas like East Montgomery and Pike Road have crime rates significantly below the city average.
4. When is the best time to move?
Late autumn (October-November) is optimal. Temperatures drop from the summer highs of 92°F to the 70s, and the rental market sees a slight vacancy increase before the winter holidays, potentially lowering rent negotiation leverage.
Explore More in AL
Popular Comparisons
City Resources
Compare Montgomery
Loading city calculator…