284,772
Population
$78,949
Median Income
$421K
Median Home Price
20%
Bachelor's Degree+
Purchasing Power Analysis
Lifestyle Impact in North Las Vegas
North Las Vegas is 2.6% cheaper than the national average. We calculate how much your salary "feels like" here.
Real Purchasing Power
$87,269
+3%
Extra lifestyle value
Relative to US Average
COL Adjusted
Real-time Metrics
Offer decision workflow
Got a job offer for North Las Vegas?
North Las Vegas sits close enough to the national cost baseline that the decision usually comes down to housing, taxes, and compensation structure more than raw salary alone.
Decode an offer in North Las Vegas
Check how salary, bonus, taxes, and North Las Vegas living costs change your real leftover cash.
Set your counteroffer
Use a negotiation-first playbook to choose between more base pay, a sign-on bridge, or a walk-away number.
Calculate walk-away pay
Turn North Las Vegas's cost structure into a city-specific salary target before you accept or push back.
Follow the relocation workflow
Use the full workflow if the decision includes relocation costs, deposits, and a city-to-city move.
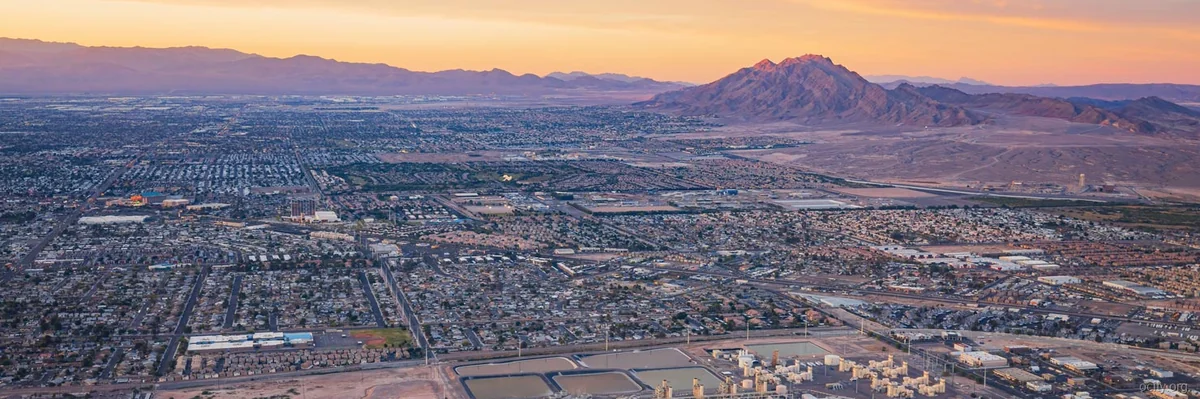
North Las Vegas: The Data Profile (2026)
North Las Vegas represents a specific statistical niche in the post-remote economy: the "high-income, high-cost" outlier. With a population of 284,772, it operates as a dense satellite city rather than a sprawling metro. The economic profile is bifurcated; the median income sits at $78,949, which is 5.9% higher than the US average of $74,580. However, this earning power is not matched by educational attainment, where only 20.4% of residents hold a college degree compared to the national average of 33.1%.
The statistical target demographic is the skilled trade or logistics professional earning above the national median but seeking lower tax burdens. This demographic prioritizes raw disposable income over traditional "prestige" metrics like education levels or walkability.
Cost of Living Analysis
While North Las Vegas boasts a favorable index for groceries (95.9) and transportation (97.6), the housing market exerts significant pressure. The housing cost of living index stands at 105.0, meaning residents pay 5.0% more than the national average for shelter, despite the city's inland location. The electricity rate, at 15.0 cents/kWh, sits slightly below the US average of 16.0 cents/kWh, a critical factor given the extreme summer cooling demands.
Table 1: Cost of Living Breakdown (Monthly Budgets)
| Category | Single Person (Monthly) | Family of 4 (Monthly) | Index vs US |
|---|---|---|---|
| Housing (Rent) | $1,200 | $2,050 | 105.0 |
| Groceries | $380 | $1,100 | 95.9 |
| Transportation | $520 | $1,350 | 97.6 |
| Healthcare | $350 | $1,100 | 99.2 |
| Restaurants | $400 | $950 | 100.8 |
| Utilities (Est) | $180 | $280 | 93.8 |
| Total | $3,030 | $6,830 | 101.5 |
Disposable Income Analysis:
A single earner making the median income of $78,949 takes home approximately $5,800 monthly (after standard taxes). With a total cost of living of $3,030, the disposable income is roughly $2,770. This is a strong surplus relative to the national curve, provided housing costs are controlled. However, for a family of 4 on a single median income, the surplus drops to $1,030 monthly, indicating that dual incomes are statistically necessary for financial comfort.
💰 Cost of Living vs US Average
North Las Vegas's prices compared to national average (100 = US Average)
Cheaper than US
More expensive
Source: BLS & BEA RPP (2025 Est.)
Housing Market Deep Dive
The housing market is the city's defining friction point. The median home price is decoupled from the local income potential. Renting is currently the statistically safer play relative to the national price-to-rent ratio. The Price/SqFt metric highlights that North Las Vegas is denser and more expensive per square foot than the US average.
Table 2: Housing Market Data (Buying vs Renting Analysis)
| Metric | North Las Vegas Value | US Average | Difference (%) |
|---|---|---|---|
| Median Home Price | $445,000 | $406,000 | +9.6% |
| Price/SqFt | $275 | $220 | +25.0% |
| Rent (1BR) | $1,450 | $1,550 | -6.5% |
| Rent (3BR) | $2,100 | $2,250 | -6.7% |
| Housing Index | 105.0 | 100.0 | +5.0% |
Buy vs. Rent Verdict:
Data suggests renting is currently the more rational financial decision. The median home price of $445,000 requires a massive capital outlay. Conversely, renting a 3-bedroom unit for $2,100 monthly costs $25,200 annually. To justify buying at $445,000, the home would need to appreciate at a rate significantly higher than inflation to offset the opportunity cost of the down payment and maintenance. For a stay duration of under 5 years, renting is the clear winner.
🏠 Real Estate Market
$421K
Median Home Price
+0.2% vs US avg
$233
Per Sq Ft
59
Days on Market
Source: Redfin 2025 estimates
Economic & Job Market Outlook
North Las Vegas has a complex employment landscape. The 5.2% unemployment rate is notably higher than the US average of 4.0%, suggesting a tighter labor market for job seekers. However, the 5.9% income premium indicates that those who are employed are compensated well for the risk.
RTO (Return to Office) & Commute:
In the post-remote era, proximity to the Las Vegas Strip and Henderson logistics hubs is vital. The average commute time is 26 minutes, but this can spike to 45+ minutes during peak tourist traffic. The local economy is heavily tethered to hospitality and construction. The "RTO" pressure in this region is lower than in traditional tech hubs, as the local workforce is largely on-site (service, trade, medical).
Salary Wars
See how far your salary goes here vs other cities.
$75,000
US National Average
$75,000
Nominal Value
Real Value in North Las Vegas
$77,002
+2.7% Purchasing Power
Purchasing Power Leaderboard
#1
North Las VegasYou
$77,002
#2
Houston
$74,850
#3
Chicago
$73,099
#4
Phoenix
$71,090
#5
New York
$66,667
💰 Income Comparison
Quality of Life Audit
North Las Vegas presents a "High Function, High Risk" health profile. While the aggregate Health Score is 78.2/100, the underlying risk factors are severe. Obesity (33.8%) and Diabetes (12.2%) rates exceed national averages, likely driven by climate (sedentary summers) and dietary culture. Air quality is a moderate concern with an AQI of 64, driven by desert dust and regional traffic.
Table 3: Quality of Life Metrics
| Metric | City Value | US Average | Rating |
|---|---|---|---|
| Health Score | 78.2/100 | 75.0/100 | Good |
| Obesity Rate | 33.8% | 31.9% | High |
| Diabetes Rate | 12.2% | 10.9% | High |
| Smoking Rate | 16.1% | 14.0% | Average |
| Mental Health | 55.0 Index | 60.0 Index | Below Avg |
| AQI | 64 | 50 | Moderate |
| PM2.5 | 10.5 µg/m³ | 8.0 µg/m³ | Moderate |
| Unemployment | 5.2% | 4.0% | High |
Safety & Crime:
- Violent Crime: 460 per 100k (US avg: 380). This is statistically AVERAGE, though skewed slightly higher than the national baseline.
- Property Crime: 2,346 per 100k (US avg: 2,000). This is AVERAGE. While not a "dangerous" city statistically, the property crime rate is 17% higher than the US median, necessitating robust home security.
Schools & Weather:
School performance correlates with the 20.4% college education rate; expect average to below-average public school ratings. Weather is currently 42.0°F with clear skies, but the annual swing is extreme, ranging from freezing winters to 110°F+ summers.
Quality of Life Metrics
Air Quality
EPA Annual Average
Good
42AQI
Air quality is satisfactory.
PM2.5 Concentration10.2 µg/m³
Health Pulse
CDC PLACES Data
78.2
Score
Obesity
33.8% Low Avg (32%) High
Diabetes
12.2% Smoking
16.1%
Based on CDC PLACES health census data. Higher score indicates better overall public health outcomes.
See healthiest US cities →
Safety Score
FBI Crime Data Estimate
Below Avg
Violent Crime
per 100k people
567.0
US Avg: 363.8
Property Crime
per 100k people
2789
US Avg: 1917
Crime rates are generally higher than the national average.
See safest US cities →
The Verdict
Pros:
- Income Premium: Median earnings are $4,369 higher annually than the US average.
- Low Overhead: Groceries (95.9) and electricity (15.0¢/kWh) offer tangible savings.
- Rent Value: Rental rates are 6.7% below the national average for family-sized units.
Cons:
- Housing Overvaluation: Buying a home costs 9.6% more than the national median.
- Health Risks: High rates of obesity (33.8%) and diabetes (12.2%).
- Economic Instability: Unemployment is 30% higher than the national average.
Final Recommendation:
North Las Vegas is a Strong Relocation Target for Renters. It is ideal for a working couple earning a combined $120,000+ who can capitalize on the income premium while avoiding the overpriced housing market. It is NOT recommended for retirees or those seeking a "walkable" or "healthy" community culture.
FAQs
1. What salary is needed to live comfortably in North Las Vegas?
For a single person, a salary of $65,000 is required to maintain a 30% savings rate after taxes and expenses. For a family, the threshold rises to $115,000.
2. Is the value better than Henderson or Summerlin?
No. North Las Vegas offers lower housing costs than Summerlin ($650k+) but higher crime rates and lower school quality than Henderson. It is the "budget" option for the metro area.
3. How dangerous is the crime?
Statistically, it is average. You are 19% more likely to experience property theft than the US average, but violent crime remains near the national baseline of 380 per 100k.
4. When is the best time to move?
Move between October and November. Temperatures drop below 70°F, making the move physically easier, and rental inventory typically increases before the holiday season. Avoid moving between June and August.
Explore More in NV
Las Vegas Henderson Reno Enterprise CDP Sunrise Manor CDP Spring Valley CDP Paradise CDP Sparks Carson
Popular Comparisons
Top Relocation Destinations from North Las Vegas
City Resources
Compare North Las Vegas
Loading city calculator…