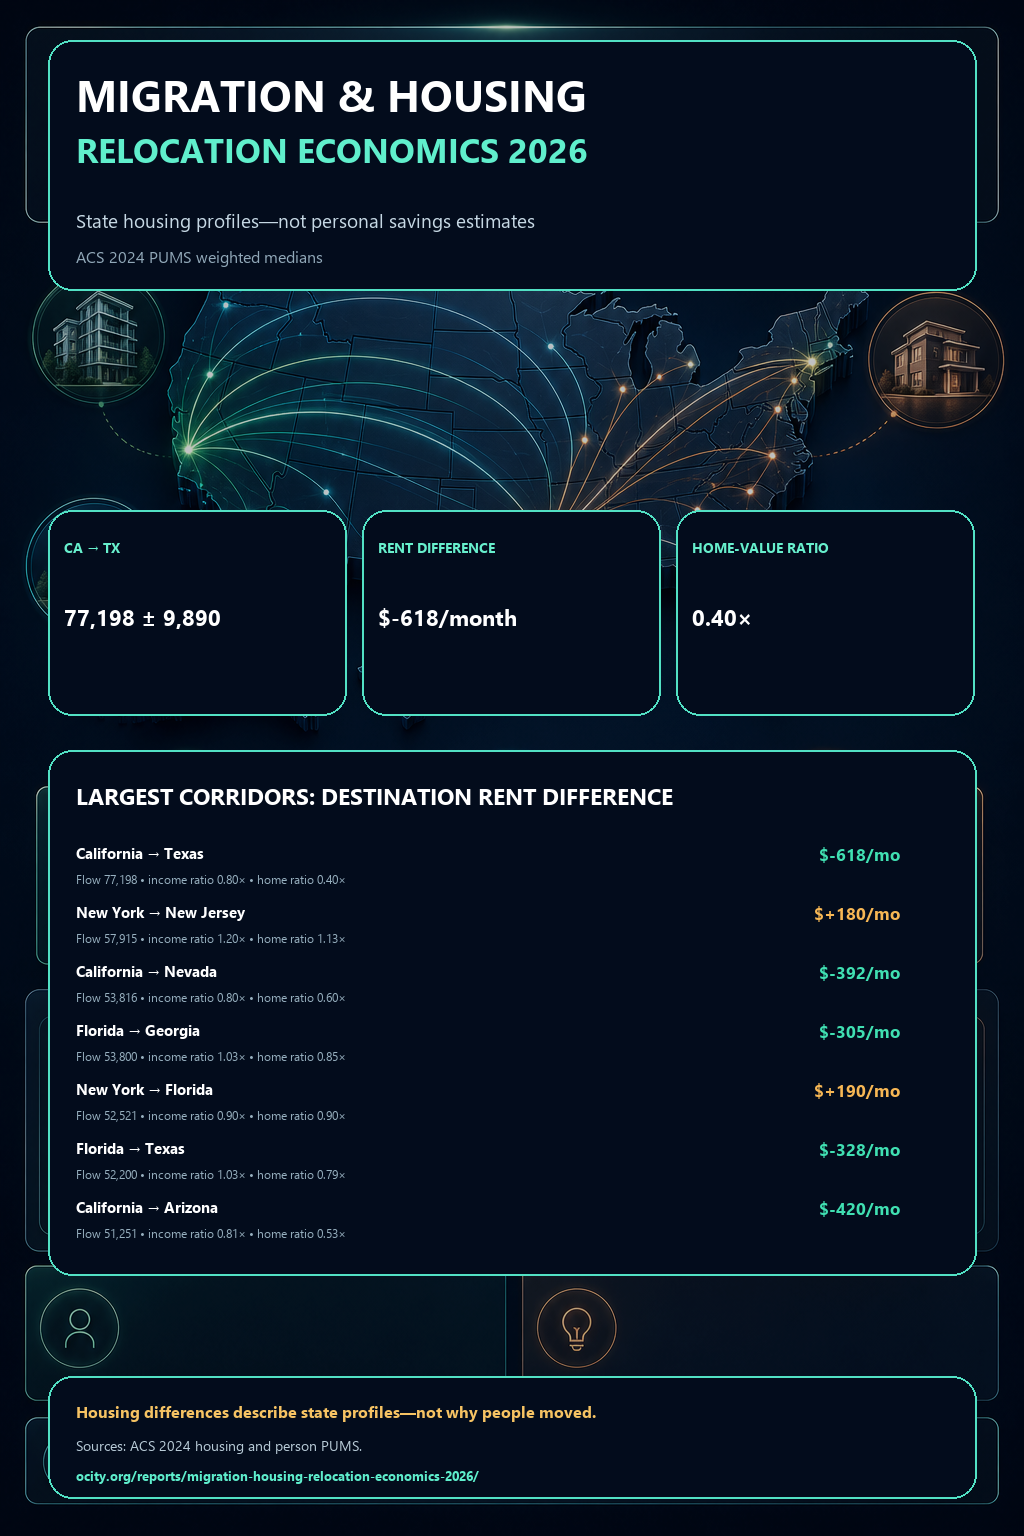
Estimated flow
77,198
±9,890

Relocation economics · 2026 edition
State rent and home-value differences add context to major corridors—but they do not prove why anyone moved or what a household saved.
Download infographicThis report joins state-level 2024 ACS housing PUMS medians to 2024 ACS migration corridors. It describes market profiles, not household decisions, personal savings or causal effects.
Estimated flow
77,198
±9,890
Gross rent
$-618/mo
destination minus origin
Home value
0.40×
destination/origin
Household income
0.80×
destination/origin
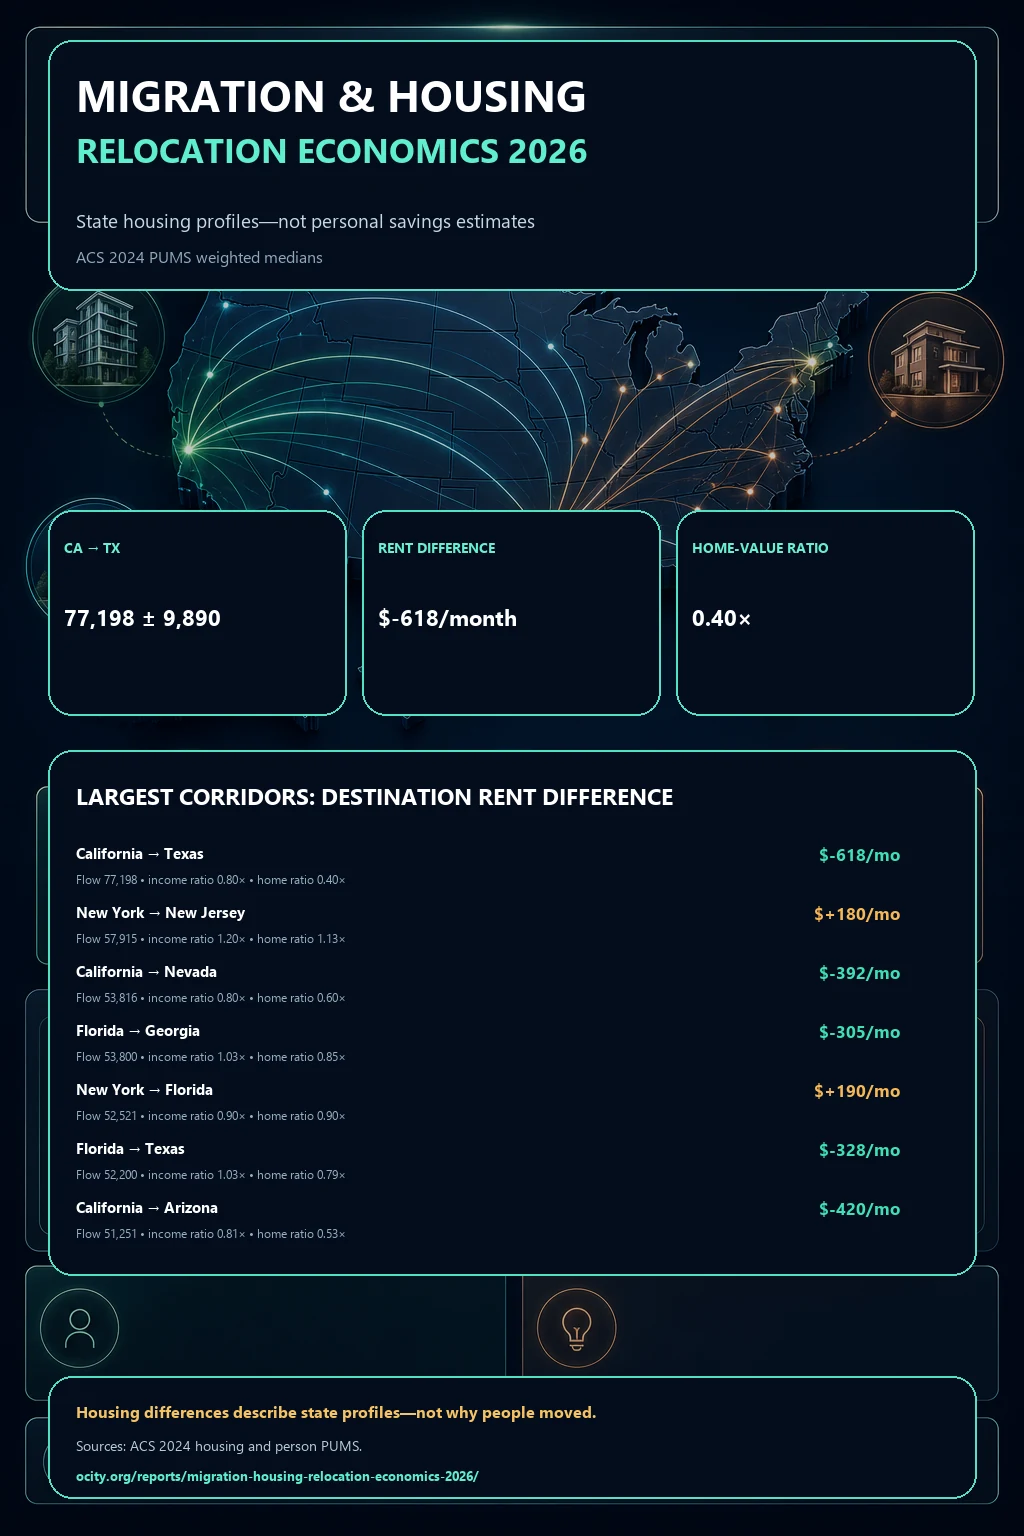
Some high-volume destinations have lower weighted state rent and home values; others are near parity or higher. Income also changes, so no single housing number represents relocation economics.
| Corridor | Flow | Rent difference | Home-value difference | Income difference |
|---|---|---|---|---|
| California → Texas | 77,198 ± 9,890 | $-618/mo | $-450,000 | $-20,000 |
| New York → New Jersey | 57,915 ± 9,105 | $180/mo | $55,000 | $17,580 |
| California → Nevada | 53,816 ± 8,136 | $-392/mo | $-300,000 | $-19,800 |
| Florida → Georgia | 53,800 ± 9,235 | $-305/mo | $-57,000 | $2,000 |
| New York → Florida | 52,521 ± 7,743 | $190/mo | $-43,000 | $-8,420 |
| Florida → Texas | 52,200 ± 8,633 | $-328/mo | $-82,000 | $2,000 |
| California → Arizona | 51,251 ± 7,068 | $-420/mo | $-350,000 | $-18,700 |
| California → Washington | 47,978 ± 6,610 | $-275/mo | $-185,000 | $0 |
| Texas → California | 45,803 ± 6,792 | $618/mo | $450,000 | $20,000 |
| Texas → Florida | 44,800 ± 12,461 | $328/mo | $82,000 | $-2,000 |
| New Jersey → Pennsylvania | 38,411 ± 5,876 | $-540/mo | $-220,000 | $-26,000 |
| California → Florida | 37,272 ± 6,499 | $-290/mo | $-368,000 | $-22,000 |
| New Jersey → New York | 36,356 ± 5,884 | $-180/mo | $-55,000 | $-17,580 |
| Georgia → Florida | 35,570 ± 6,622 | $305/mo | $57,000 | $-2,000 |
| North Carolina → South Carolina | 33,839 ± 6,269 | $-71/mo | $-5,000 | $-2,200 |
| Pennsylvania → Florida | 33,011 ± 6,618 | $550/mo | $122,000 | $0 |
| Florida → North Carolina | 31,489 ± 4,584 | $-455/mo | $-82,000 | $-3,500 |
| New York → Pennsylvania | 31,014 ± 5,483 | $-360/mo | $-165,000 | $-8,420 |
| Oregon → Washington | 30,723 ± 4,537 | $245/mo | $75,000 | $15,000 |
| California → Oregon | 30,239 ± 4,949 | $-520/mo | $-260,000 | $-15,000 |
Housing indicators are housing-weighted medians among positive reported ACS 2024 PUMS values. Migration uses person-weighted ACS 2024 PUMS with replicate-weight MOEs. Joining at state level cannot represent a specific city, tenure, mortgage, tax situation or household.
FHFA state appreciation is intentionally excluded because an exact full-state official download was not independently verified during this build.