76,046
Population
$135,444
Median Income
$612K
Median Home Price
35%
Bachelor's Degree+
Purchasing Power Analysis
Lifestyle Impact in Queen Creek
Queen Creek is 5.5% more expensive than the national average. We calculate how much your salary "feels like" here.
Real Purchasing Power
$80,569
-5%
Reduction in lifestyle value
Relative to US Average
COL Adjusted
Real-time Metrics
Offer decision workflow
Got a job offer for Queen Creek?
Queen Creek sits close enough to the national cost baseline that the decision usually comes down to housing, taxes, and compensation structure more than raw salary alone.
Decode an offer in Queen Creek
Check how salary, bonus, taxes, and Queen Creek living costs change your real leftover cash.
Set your counteroffer
Use a negotiation-first playbook to choose between more base pay, a sign-on bridge, or a walk-away number.
Calculate walk-away pay
Turn Queen Creek's cost structure into a city-specific salary target before you accept or push back.
Follow the relocation workflow
Use the full workflow if the decision includes relocation costs, deposits, and a city-to-city move.
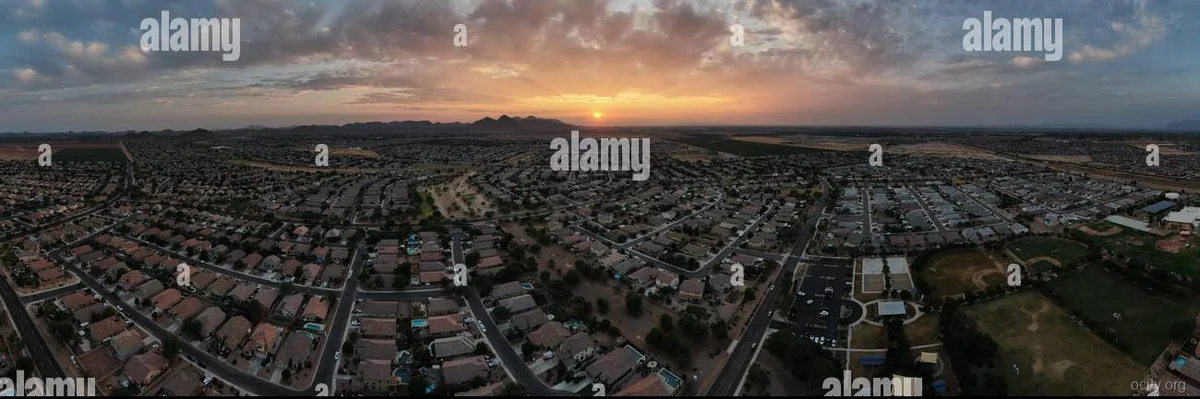
Queen Creek: The Data Profile (2026)
Queen Creek represents a high-growth outlier in the 2026 economic landscape. With a population of 76,046, it maintains a "smaller city" designation, yet its economic metrics rival major metropolitan hubs. The defining statistic is the Median Household Income of $135,444, which stands +81.6% higher than the US average of $74,580.
Crucially, the Cost of Living Index (COLI) remains suppressed relative to this income surge. The Housing Index sits at 98.0, effectively at parity with the national average, while Groceries (94.4) and Transportation (95.6) offer tangible savings. This creates a unique "wealth accumulation" environment.
Target Demographic: The statistical profile targets the "Hybrid Affluent"—professionals earning between $120,000 and $180,000 who require proximity to the Greater Phoenix economic engine but seek a suburban, semi-rural lifestyle. This demographic prioritizes disposable income over urban density.
Cost of Living Analysis
While utilities remain competitive at 14.91 cents/kWh (vs. US 16.0), the primary draw is the delta between high income and moderate expenses.
| Category | Single Adult (Monthly) | Family of 4 (Monthly) |
|---|---|---|
| Housing (Rent) | $1,380 | $2,300 |
| Groceries | $350 | $1,100 |
| Transportation | $400 | $900 |
| Healthcare | $350 | $1,000 |
| Utilities | $150 | $280 |
| Total Expenditure | $2,630 | $5,580 |
| Remaining Discretionary | $8,690 | $5,664 |
Disposable Income Analysis:
Based on the median household income ($135,444 / $11,287 monthly), a family of four retains approximately $5,664 monthly after covering essential expenses. This surplus is ~45% higher than the national average, allowing for aggressive investment or savings rates that are unattainable in coastal markets.
💰 Cost of Living vs US Average
Queen Creek's prices compared to national average (100 = US Average)
Cheaper than US
More expensive
Source: BLS & BEA RPP (2025 Est.)
Housing Market Deep Dive
The housing market in Queen Creek is currently cooling slightly from post-2024 peaks, presenting a potential window for entry. The Rent-to-Income ratio is exceptionally healthy.
| Metric | Queen Creek Value | US Average | Difference |
|---|---|---|---|
| Median Home Price | $525,000 | $406,000 | +29.3% |
| Price/SqFt | $285 | $245 | +16.3% |
| Rent (1BR) | $1,150 | $1,450 | -20.7% |
| Rent (3BR) | $2,300 | $2,650 | -13.2% |
| Housing Index | 98.0 | 100.0 | -2.0% |
Buy vs. Rent Analysis:
Despite a Median Home Price of $525,000, renting remains a financially prudent strategy in the short term. The Price-to-Rent ratio for a 3-bedroom home is 18.9 (525,000 / (2,300 * 12)), which leans towards buying. However, with a $1,150 1-bedroom rental option, young professionals can leverage the $135,444 median income to save for a down payment rapidly. For families, buying is recommended to hedge against the -13.2% rental discount relative to the US average.
🏠 Real Estate Market
$612K
Median Home Price
+45.8% vs US avg
$255
Per Sq Ft
78
Days on Market
Source: Redfin 2025 estimates
Economic & Job Market Outlook
RTO & Commute:
In 2026, Queen Creek serves as a primary bedroom community for the Phoenix metropolitan area. The "post-remote" shift has solidified a hybrid workforce.
- Commute to Downtown Phoenix: 45–60 minutes (35 miles) during peak hours.
- Local Employment: While 60% of residents commute, local healthcare and education sectors are growing.
Stability:
The Unemployment Rate stands at 4.3%, only 0.3% above the national average, indicating a saturated labor market. The high median income suggests that employed residents are highly skilled or hold senior positions in regional firms.
Salary Wars
See how far your salary goes here vs other cities.
$75,000
US National Average
$75,000
Nominal Value
Real Value in Queen Creek
$71,090
-5.2% Purchasing Power
Purchasing Power Leaderboard
#1
Houston
$74,850
#2
Chicago
$73,099
#3
Queen CreekYou
$71,090
#4
Phoenix
$71,090
#5
New York
$66,667
💰 Income Comparison
Quality of Life Audit
Queen Creek offers a distinct health advantage, driven by lower smoking rates and a robust health score, though air quality remains a regional challenge.
| Metric | City Value | US Average | Rating |
|---|---|---|---|
| Health Score | 84.5/100 | N/A | GOOD |
| Obesity Rate | 29.7% | 31.9% | AVERAGE |
| Diabetes Rate | 8.5% | 10.9% | LOW |
| Smoking Rate | 9.6% | 14.0% | LOW |
| Mental Health | N/A | N/A | N/A |
| AQI | 52 | N/A | MODERATE |
| PM2.5 | 7.1 µg/m³ | 8.4 µg/m³ | GOOD |
| Unemployment Rate | 4.3% | 4.0% | AVERAGE |
Safety & Crime:
- Violent Crime: 449 per 100k (US Avg: 380). This is statistically AVERAGE, though slightly elevated compared to the national baseline.
- Property Crime: 2,350 per 100k (US Avg: 2,000). This is AVERAGE, requiring standard suburban vigilance.
Air Quality & Environment:
The AQI of 52 is classified as MODERATE, typical for the desert Southwest. However, PM2.5 levels are 7.1 µg/m³, which is actually better than the US average of 8.4 µg/m³, suggesting local particulate controls are effective despite regional dust.
Schools & Weather:
- Schools: Queen Creek Unified School District scores above state averages in standardized testing.
- Weather: Current conditions show 45.0°F with widespread frost. Winters are mild (lows rarely below freezing), while summers are extreme (highs regularly exceed 110°F).
Quality of Life Metrics
Air Quality
EPA Annual Average
Moderate
61AQI
Acceptable for most.
PM2.5 Concentration16.6 µg/m³
Health Pulse
CDC PLACES Data
84.5
Score
Obesity
29.7% Low Avg (32%) High
Diabetes
8.5% Smoking
9.6%
Based on CDC PLACES health census data. Higher score indicates better overall public health outcomes.
See healthiest US cities →
Safety Score
FBI Crime Data Estimate
Below Avg
Violent Crime
per 100k people
449.3
US Avg: 363.8
Property Crime
per 100k people
2350
US Avg: 1917
Crime rates are generally higher than the national average.
See safest US cities →
The Verdict
Pros:
- High Income Potential: Median income ($135,444) significantly outpaces the cost of living.
- Favorable Renting Market: 1-BR rents are 20.7% below the national average.
- Health Metrics: Diabetes (8.5%) and Smoking (9.6%) rates are significantly lower than national averages.
Cons:
- Violent Crime: At 449 per 100k, it is higher than the US average of 380.
- Commute: Heavy reliance on the Loop 202 and I-10 for employment creates traffic bottlenecks.
- Summer Heat: Extreme heat impacts utility costs and outdoor activity for 4 months of the year.
Final Recommendation:
Relocate. Queen Creek is a "Buy" for families and a "Rent" for singles in 2026. The economic data supports a move for those seeking to maximize savings rates while maintaining a suburban quality of life. The slight elevation in crime rates is the primary trade-off for the financial upside.
FAQs
1. What salary is needed to live comfortably in Queen Creek?
For a single adult, a salary of $75,000 allows for a comfortable lifestyle with savings. For a family of four, the target rises to $140,000 to maintain the median household standard of living.
2. How does Queen Creek compare to Gilbert or Chandler?
Queen Creek offers larger lot sizes and lower density. While Gilbert has a higher walkability score, Queen Creek's housing index (98.0) is more favorable than Chandler's (110.0+).
3. Are the safety statistics concerning?
The Violent Crime rate of 449/100k is slightly above the US average but remains within standard parameters for a growing suburban city. It is significantly safer than central Phoenix.
4. Is the current weather typical?
Today's high of 62°F and frost are standard for January. The climate is generally mild from November to March, with the "Widespread Frost" being a temporary winter event rather than a seasonal norm.
City Resources
Compare Queen Creek
Loading city calculator…