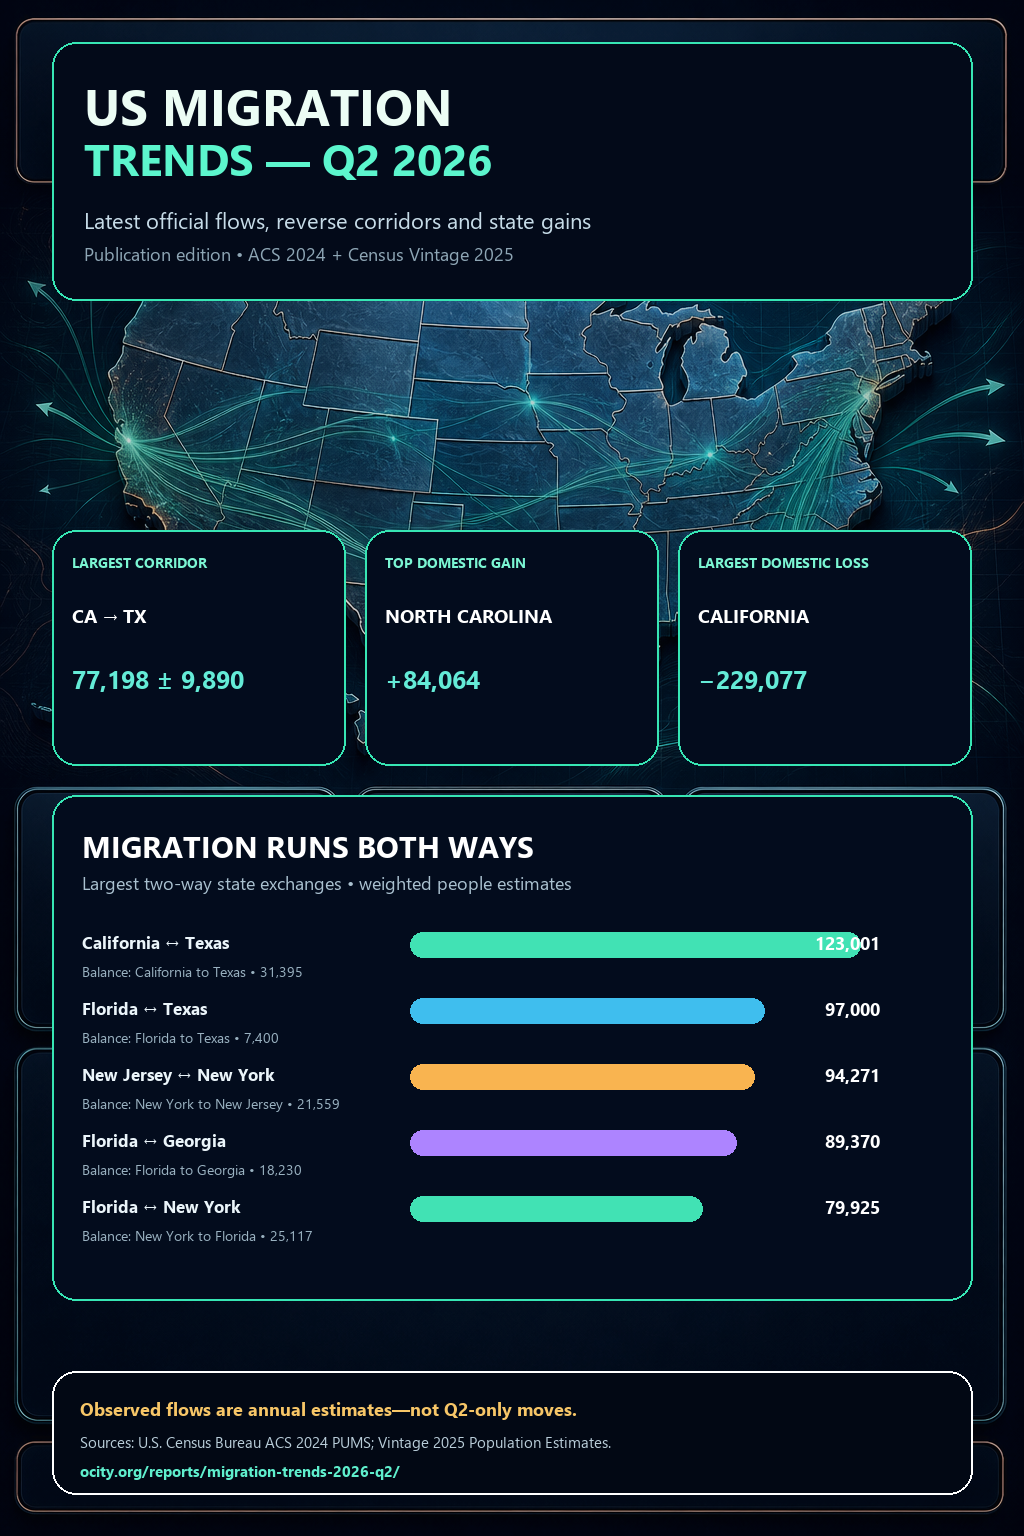
New leader
North Carolina
+84,064
Latest net domestic migration—above Texas and South Carolina.
The latest evidence reveals new state leaders, powerful reverse flows and a sharp distinction between domestic and international migration.
Corridors use 2024 ACS 1-year estimates. State net domestic migration uses Census Vintage 2025 for July 1, 2024–July 1, 2025. Q2 describes when this analysis was published and interpreted.
New leader
+84,064
Latest net domestic migration—above Texas and South Carolina.
Largest corridor
77,198
90% MOE ±9,890; reverse flow Texas → California was 45,803.
Two-way exchange
123,001
Gross movement in both directions; directional balance was 31,395 toward Texas.
Gross exchange adds both directions. Balance measures the difference—not the total movement.
Balance: California to Texas • 31,395
Balance: Florida to Texas • 7,400
Balance: New York to New Jersey • 21,559
Balance: Florida to Georgia • 18,230
Balance: New York to Florida • 25,117
Balance: California to Arizona • 22,705
Balance: California to Nevada • 32,317
Balance: California to Washington • 22,339
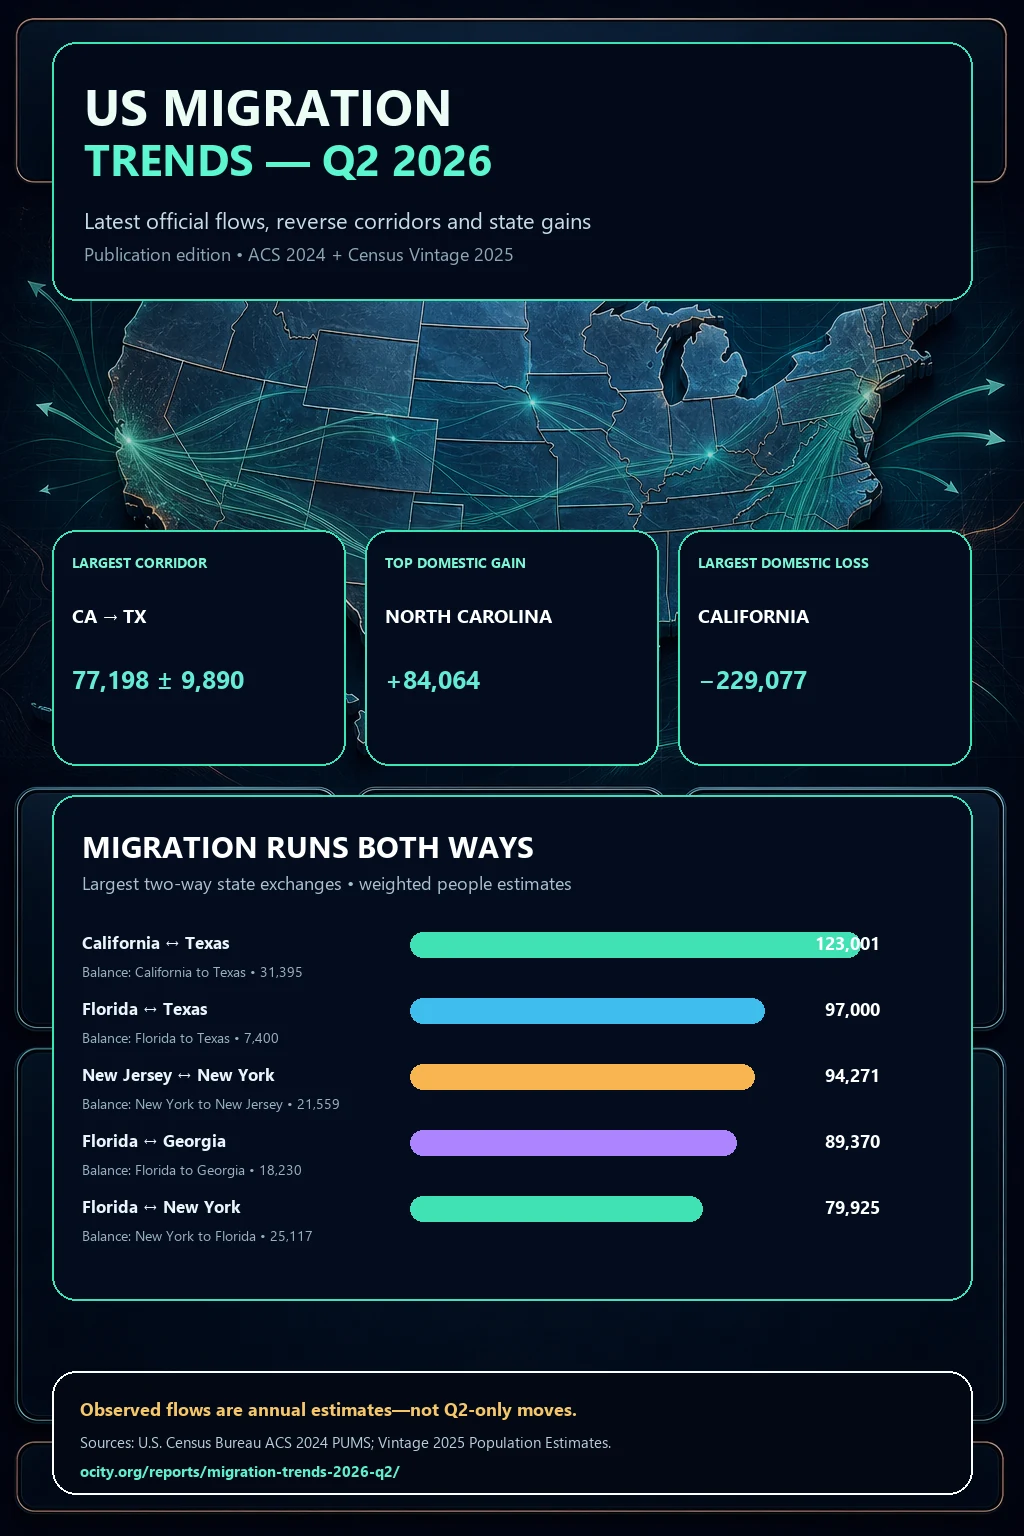
Weighted people estimates with 90% margins of error.
| Rank | Corridor | Estimate | 90% MOE |
|---|---|---|---|
| 1 | California Texas | 77,198 | ±9,890 |
| 2 | New York New Jersey | 57,915 | ±9,105 |
| 3 | California Nevada | 53,816 | ±8,136 |
| 4 | Florida Georgia | 53,800 | ±9,235 |
| 5 | New York Florida | 52,521 | ±7,743 |
| 6 | Florida Texas | 52,200 | ±8,633 |
| 7 | California Arizona | 51,251 | ±7,068 |
| 8 | California Washington | 47,978 | ±6,610 |
| 9 | Texas California | 45,803 | ±6,792 |
| 10 | Texas Florida | 44,800 | ±12,461 |
Corridors: Ocity aggregates ACS 2024 1-year PUMS using prior state (`MIGSP`), current state (`STATE`) and person weight (`PWGTP`). MOE uses all 80 replicate weights.
State outcomes: Net domestic, international and total migration components come from Census `NST-EST2025-COMP` for July 1, 2024–July 1, 2025.
Caution: These datasets describe movement, not personal motivations. The report does not claim taxes, housing, remote work or politics caused any corridor.