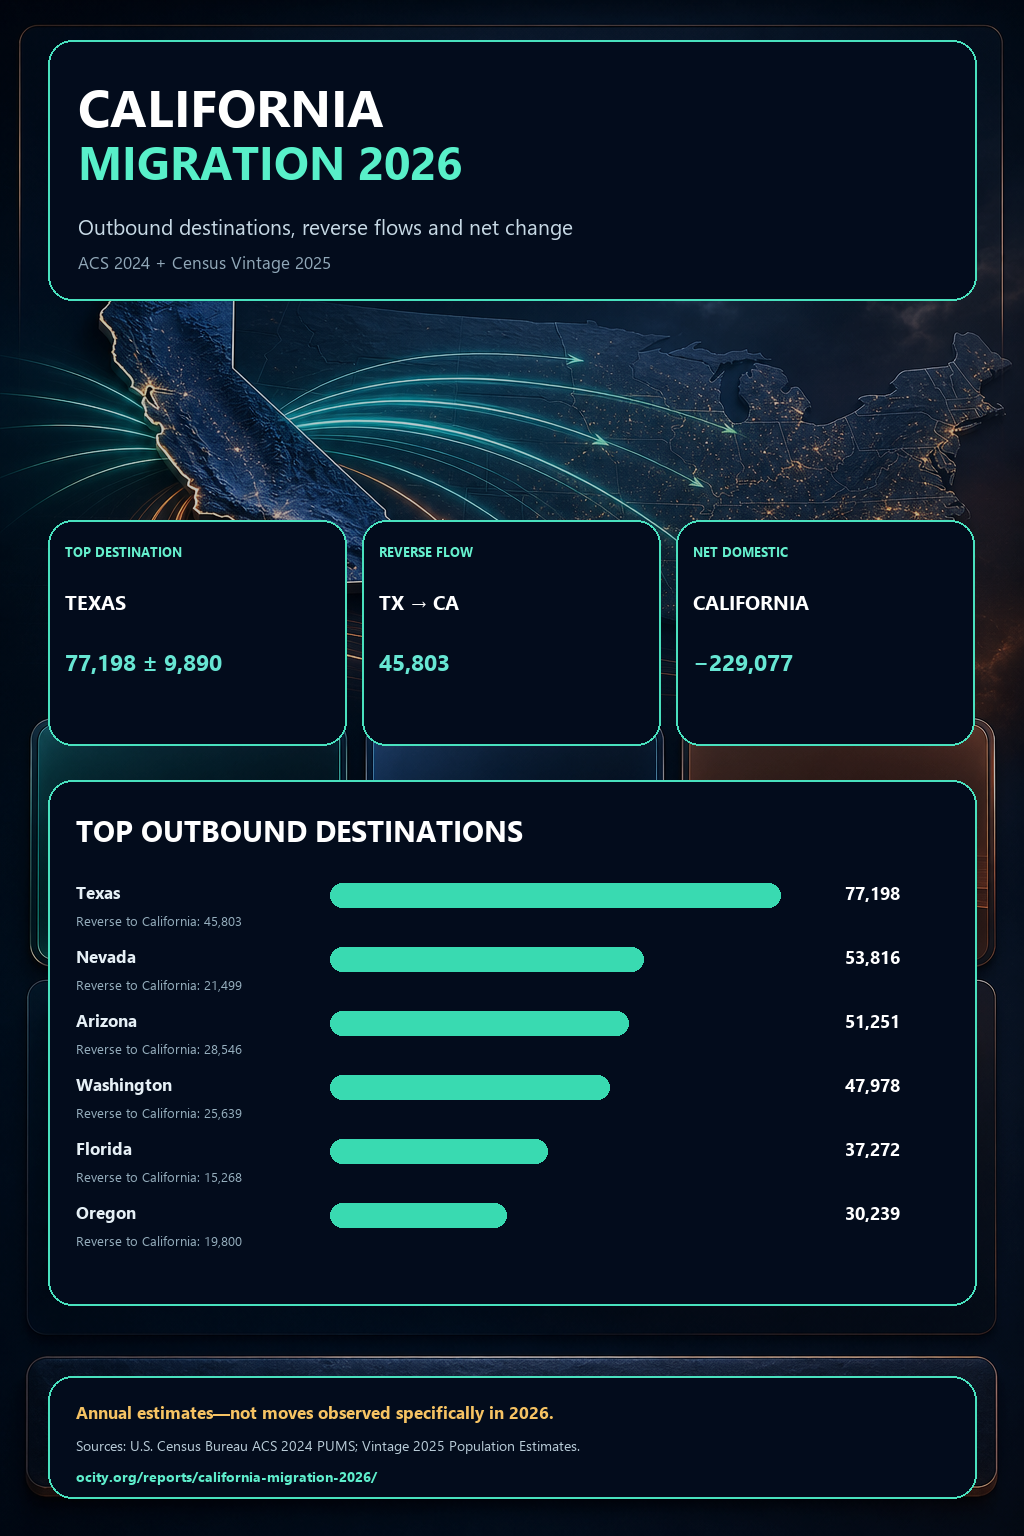
CA → Texas
77,198
90% MOE ±9,890
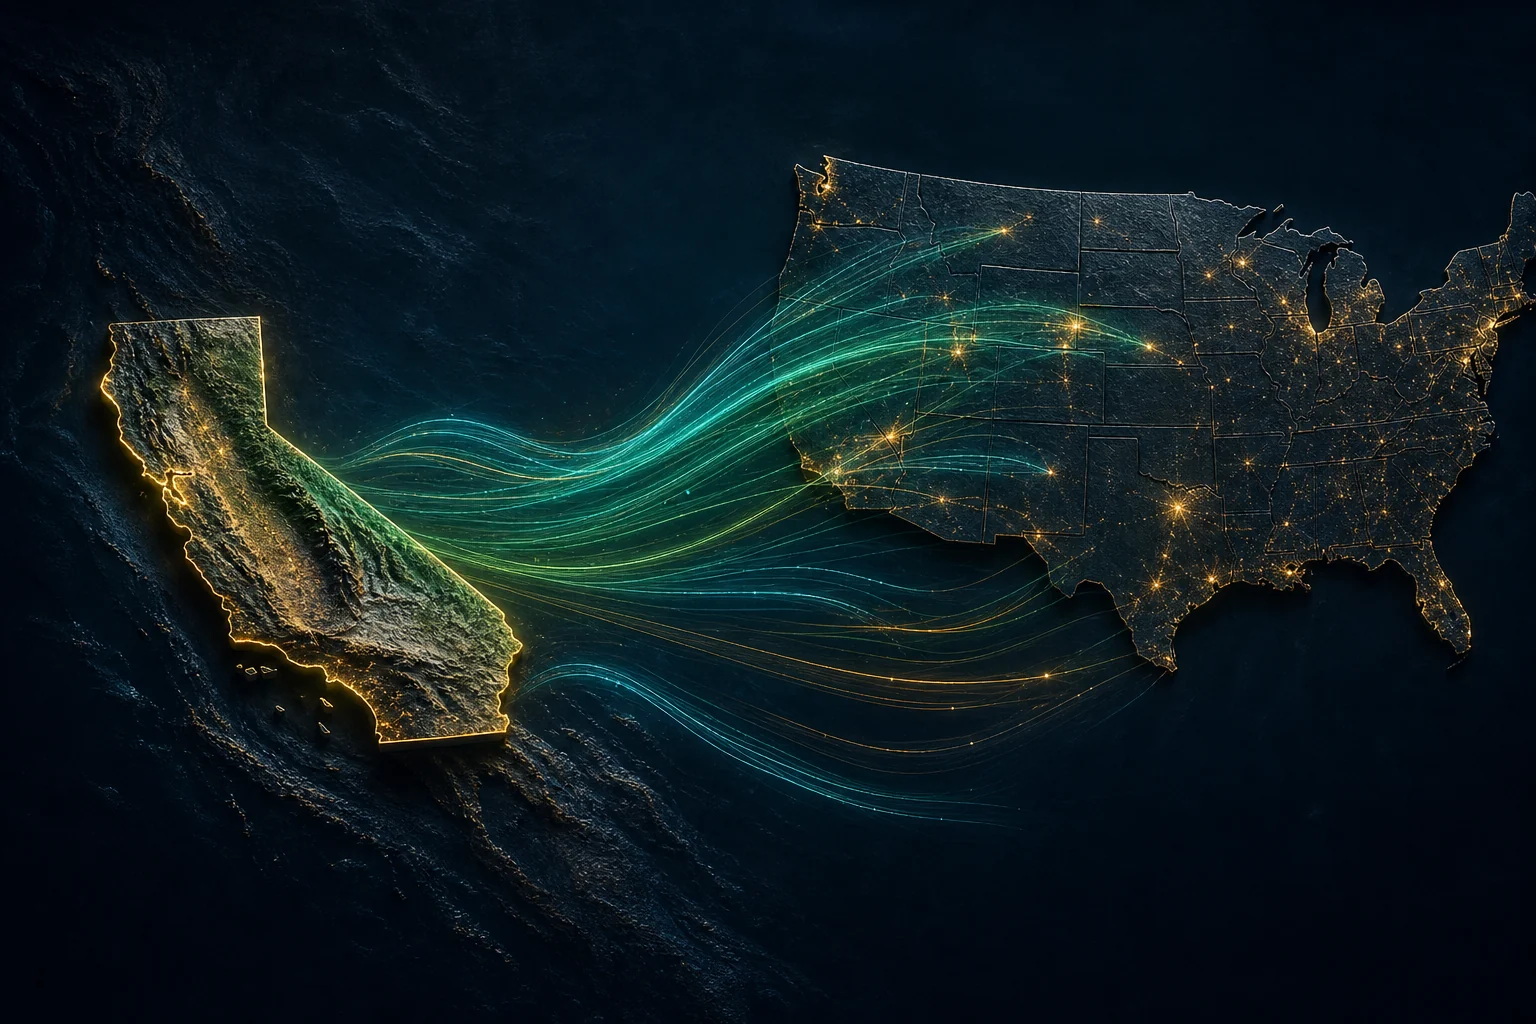
The largest outbound routes are real—but reverse flows reveal a more complex exchange between California and the rest of America.
State-to-state flows are 2024 ACS annual estimates. California population components cover July 1, 2024–July 1, 2025 in Census Vintage 2025. “2026” is the report edition, not the flow observation year.
CA → Texas
77,198
90% MOE ±9,890
Texas → CA
45,803
Reverse flow
Gross exchange
123,001
Both directions
Net domestic
−229,077
2024–2025 PEP
Weighted annual estimates; bar length shows outbound volume.
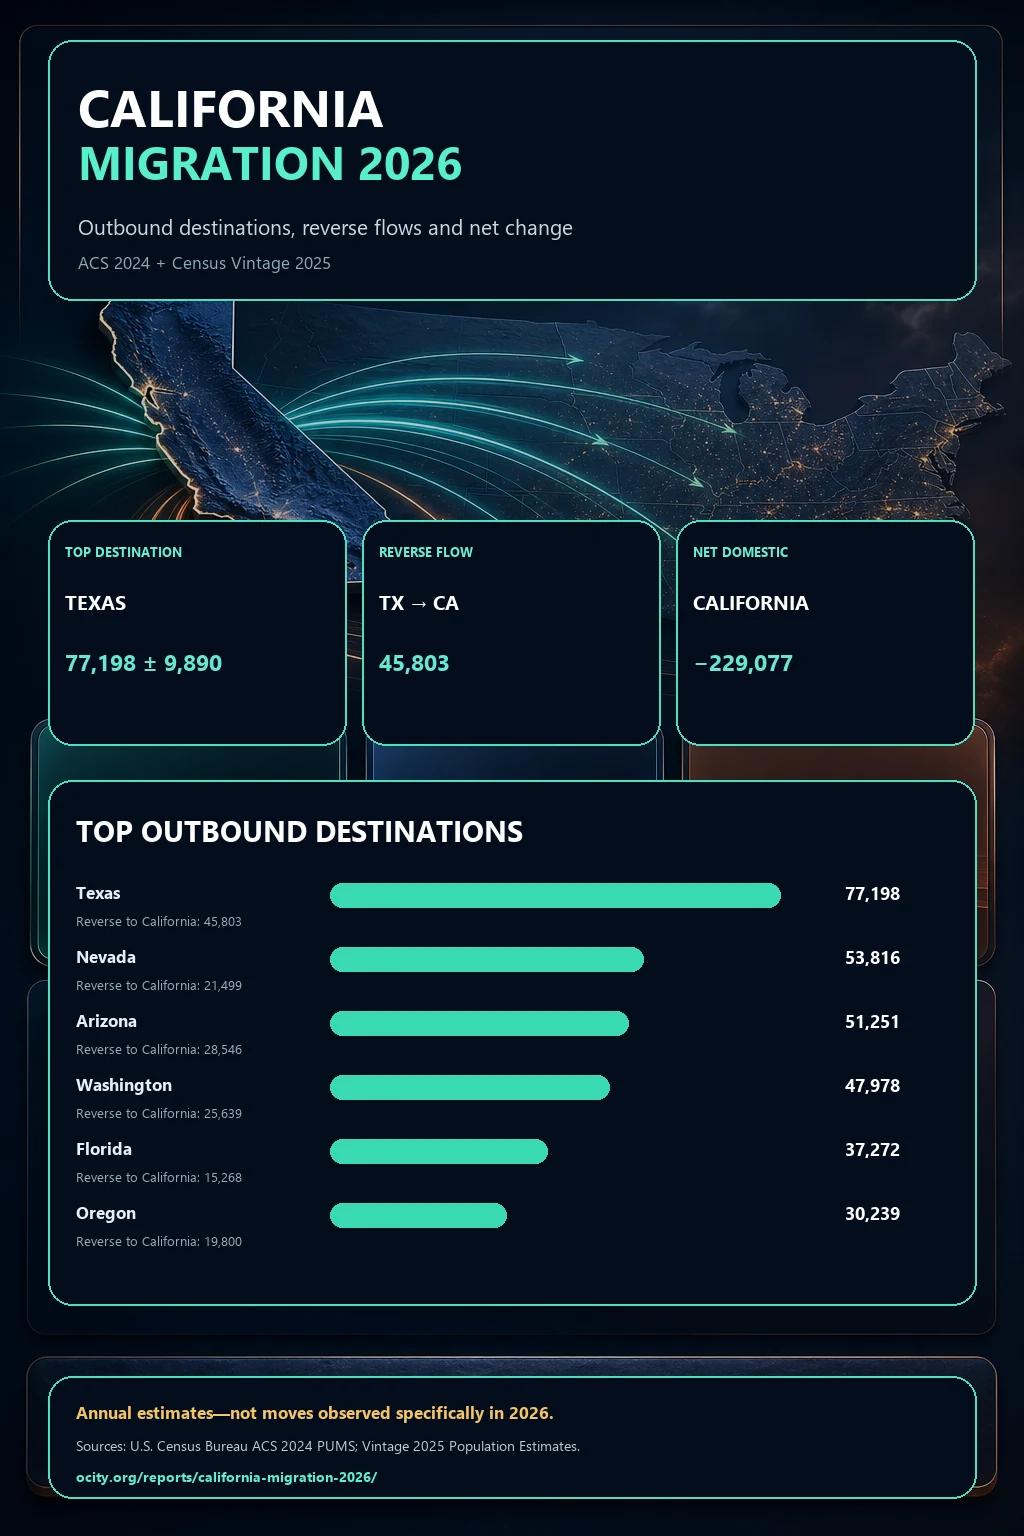
Every major route also carries people back to California. Gross exchange and directional balance answer different questions.
| State pair | CA outbound | Into CA | Gross exchange | Dominant direction |
|---|---|---|---|---|
| California ↔ Texas | 77,198 | 45,803 | 123,001 | California to Texas · 31,395 |
| California ↔ Arizona | 51,251 | 28,546 | 79,797 | California to Arizona · 22,705 |
| California ↔ Nevada | 53,816 | 21,499 | 75,315 | California to Nevada · 32,317 |
| California ↔ Washington | 47,978 | 25,639 | 73,617 | California to Washington · 22,339 |
| California ↔ New York | 30,149 | 25,609 | 55,758 | California to New York · 4,540 |
| California ↔ Florida | 37,272 | 15,268 | 52,540 | California to Florida · 22,004 |
| California ↔ Oregon | 30,239 | 19,800 | 50,039 | California to Oregon · 10,439 |
| California ↔ Virginia | 19,332 | 16,371 | 35,703 | California to Virginia · 2,961 |
Ocity aggregates 2024 ACS 1-year PUMS using current state, prior state and person weights. Margins use all 80 replicate weights. Population components come directly from Census Vintage 2025. Flow estimates and net population components are separate statistical products.