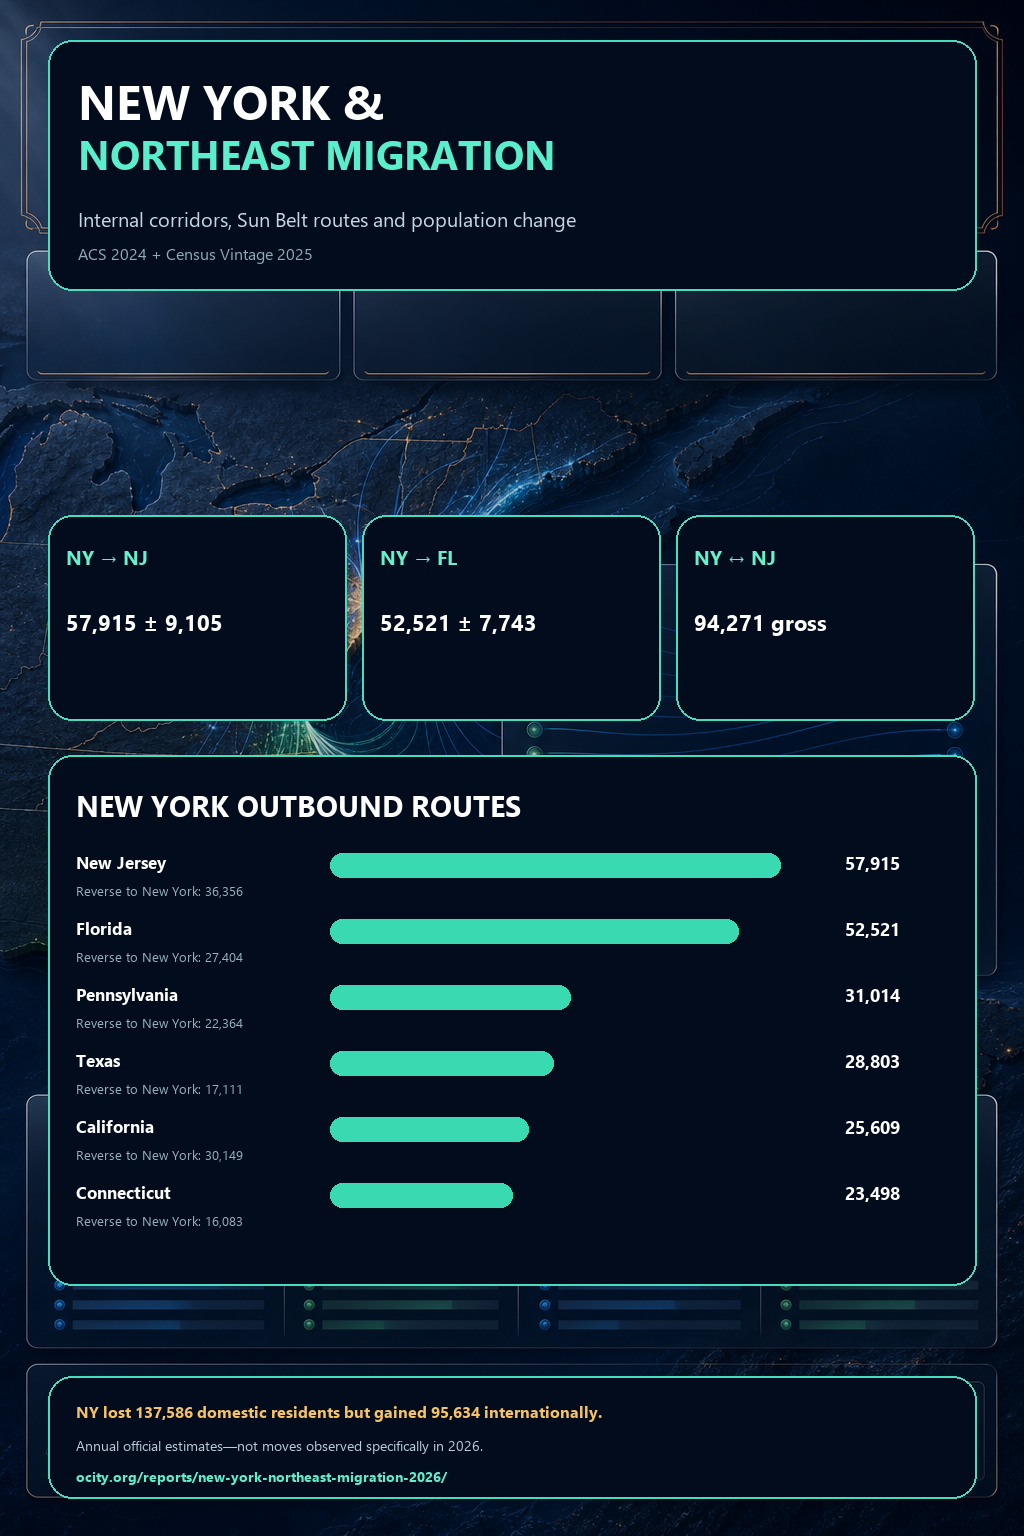
NY → NJ
57,915
±9,105

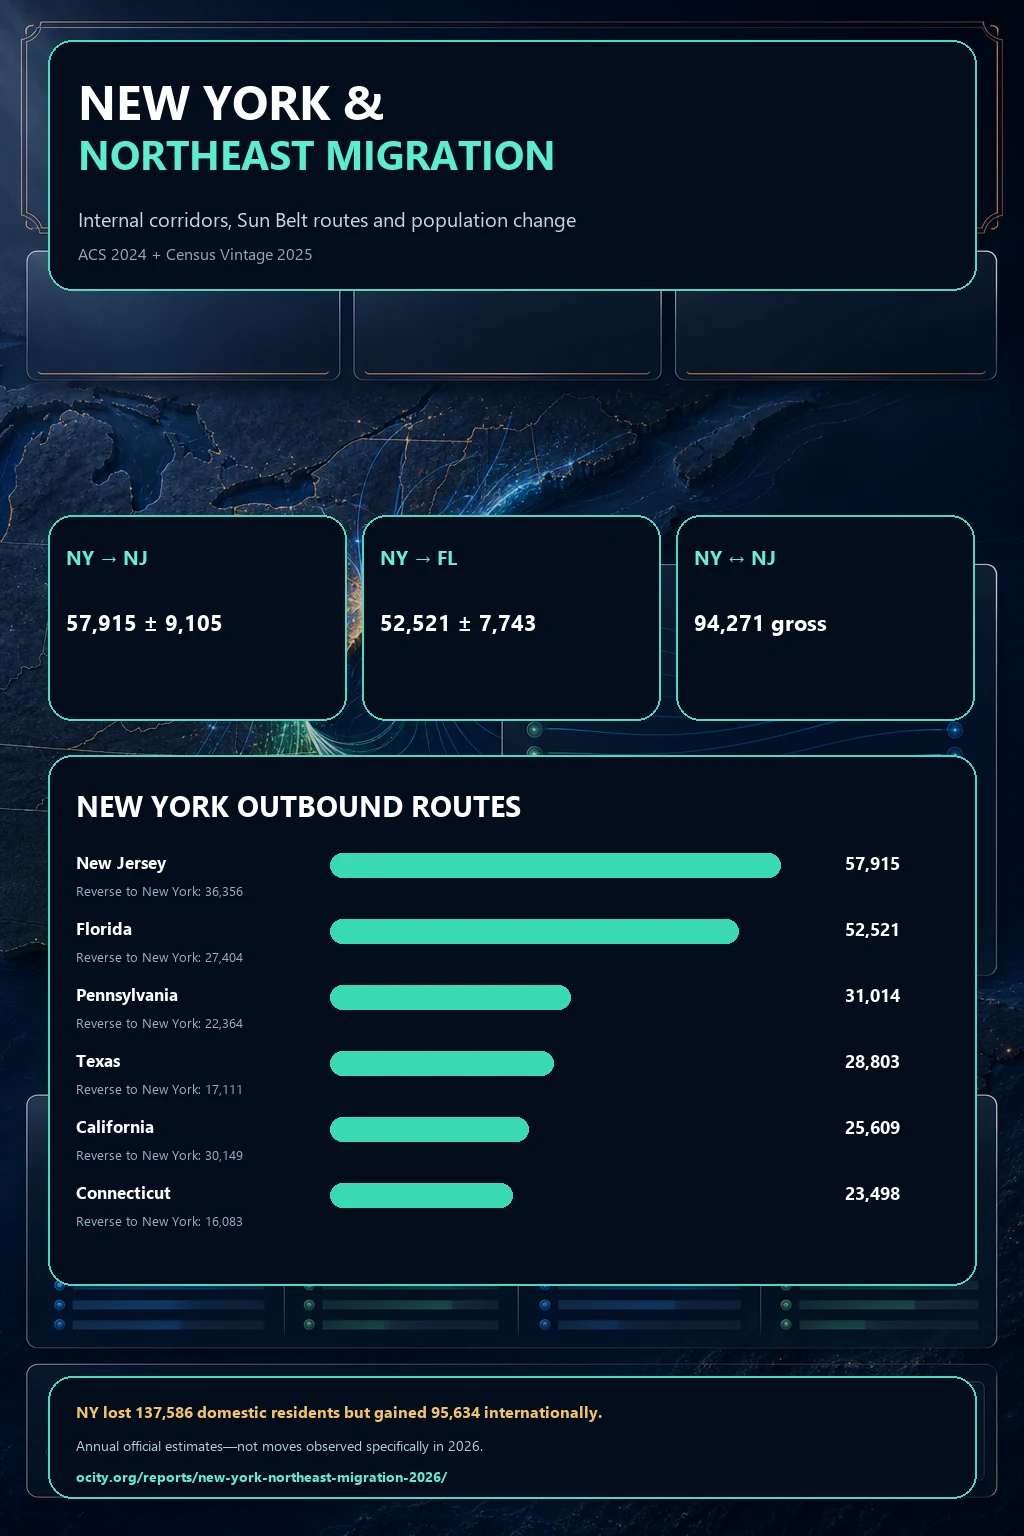
New York → New Jersey exceeded New York → Florida, while reverse flows and international migration complicate the usual Northeast-loss narrative.
Download infographicFlows use ACS 2024 annual estimates. State components cover July 1, 2024–July 1, 2025.
NY → NJ
57,915
±9,105
NY → Florida
52,521
±7,743
NJ → NY
36,356
reverse flow
NY ↔ NJ
94,271
gross exchange
| Pair | From NY | Into NY | Gross | Direction |
|---|---|---|---|---|
| NY ↔ New Jersey | 57,915 | 36,356 | 94,271 | New York to New Jersey |
| NY ↔ Florida | 52,521 | 27,404 | 79,925 | New York to Florida |
| NY ↔ California | 25,609 | 30,149 | 55,758 | California to New York |
| NY ↔ Pennsylvania | 31,014 | 22,364 | 53,378 | New York to Pennsylvania |
| NY ↔ Texas | 28,803 | 17,111 | 45,914 | New York to Texas |
| NY ↔ Connecticut | 23,498 | 16,083 | 39,581 | New York to Connecticut |
| NY ↔ Massachusetts | 18,098 | 19,089 | 37,187 | Massachusetts to New York |
| NY ↔ Virginia | 15,725 | 11,100 | 26,825 | New York to Virginia |
Corridors are weighted ACS PUMS estimates with 90% margins from replicate weights. Population components come from Census Vintage 2025. The data describe movement, not why people moved.