Santa Monica skyline

Santa Monica, CA

Complete city guide with real-time data from official US government sources.

54°
Current
Sunny
H: 78° L: 50°
89,939
Population
$109,503
Median Income
$1.80M
Median Home Price
N/A
Bachelor's Degree+
Purchasing Power Analysis

Lifestyle Impact in Santa Monica

Santa Monica is 15.5% more expensive than the national average. We calculate how much your salary "feels like" here.

Real Purchasing Power
$73,593
-13%
Reduction in lifestyle value
Relative to US Average
COL Adjusted
Real-time Metrics

Santa Monica: The Data Profile (2026)

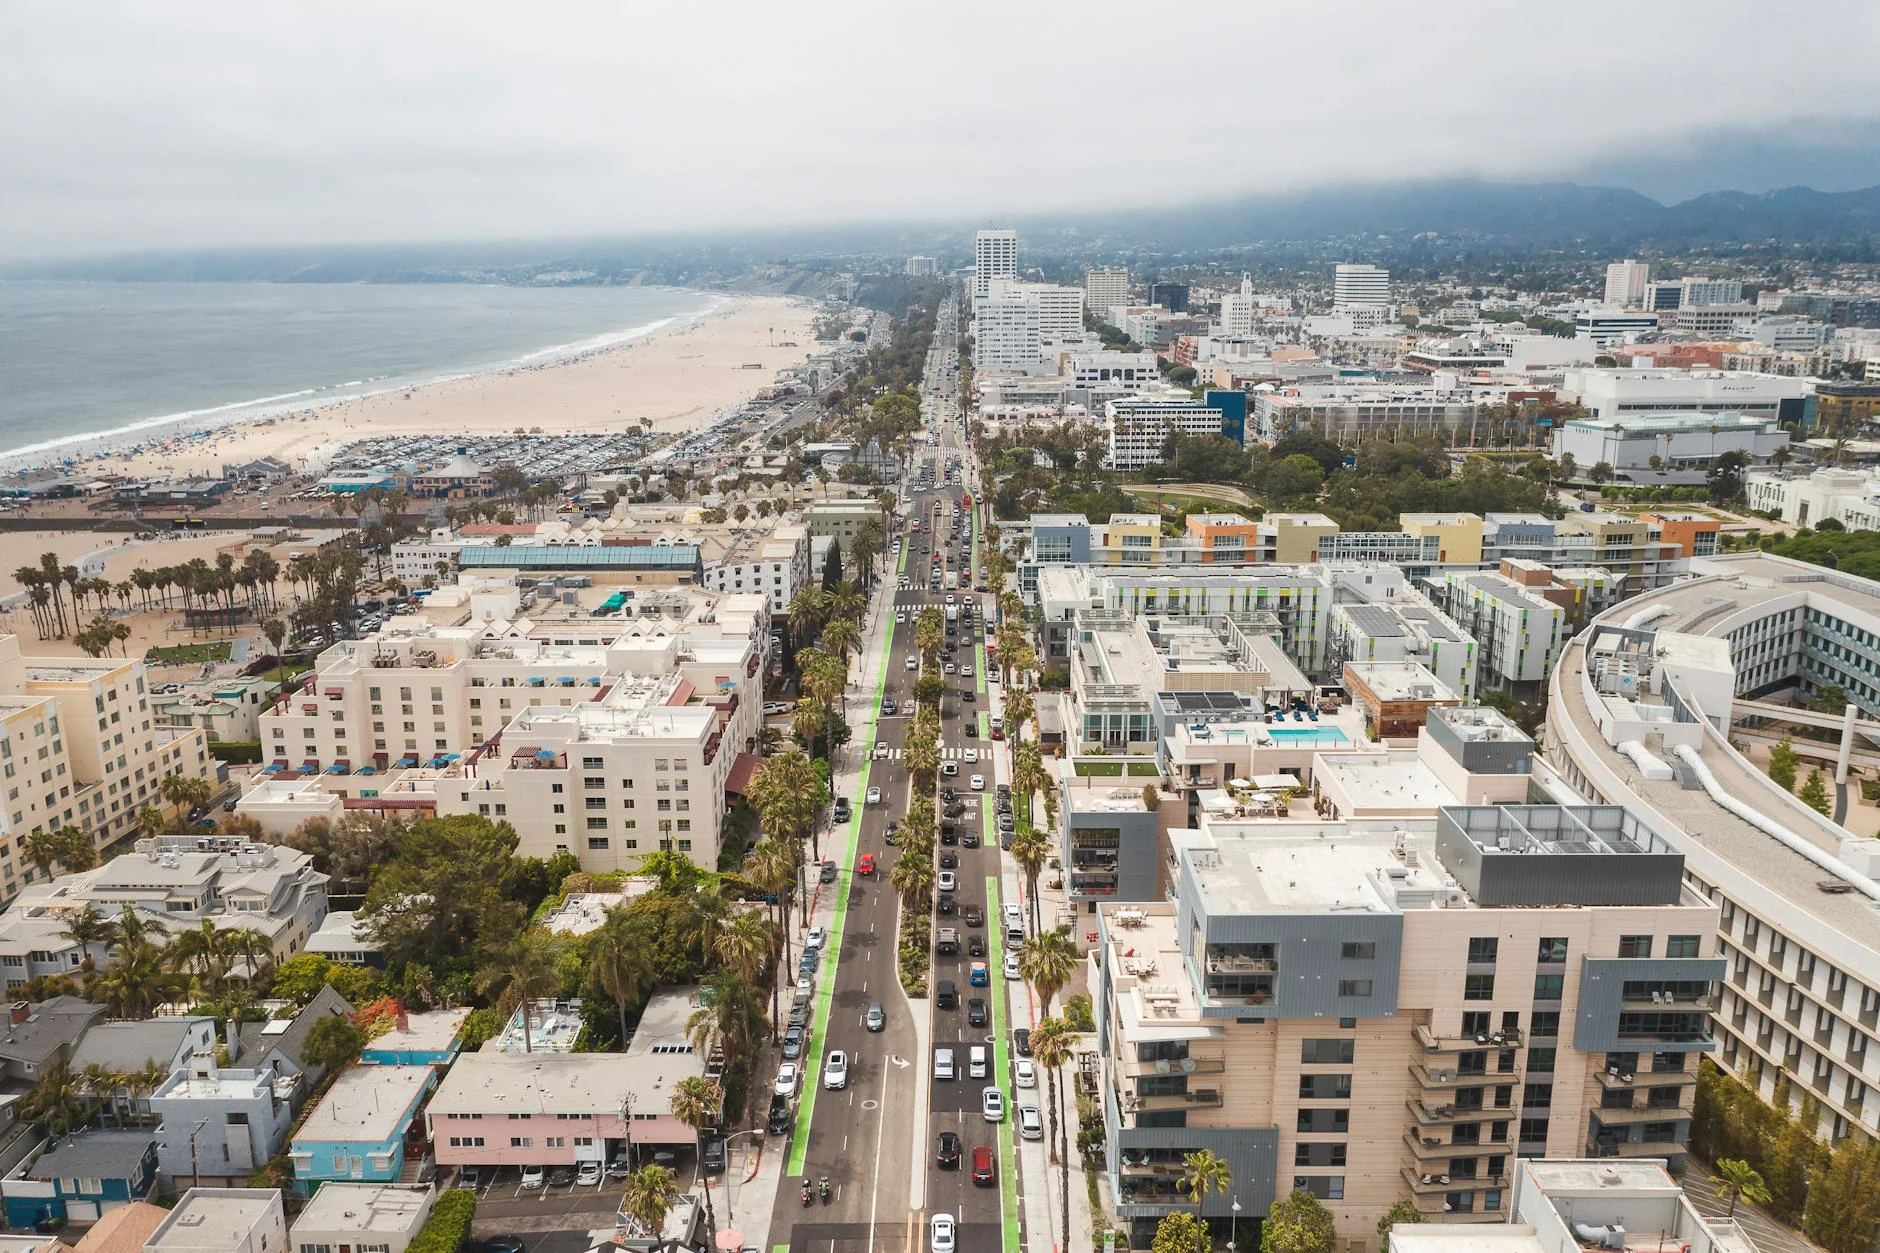
Santa Monica represents a distinct statistical outlier in the post-remote economy. With a population of 89,939, it functions less as a standalone city and more as a high-density node within the Greater Los Angeles metropolitan corridor. The economic barrier to entry is substantial: the median household income sits at $109,503, a 46.8% premium over the national median of $74,580. However, this income delta is immediately absorbed by a cost-of-living index driven almost entirely by housing, which sits 145.0% of the US average.

The statistical target demographic for Santa Monica in 2026 is the "High-Earning Hybrid Professional." This is an individual or family earning above $150,000 annually who is required to be in-office 2–3 days per week. The data suggests that while the city offers an elite quality of life, the economic model requires a dual-income household or significant equity to sustain a middle-class lifestyle relative to national standards.

City Score

Cost of Living Analysis

The cost of living in Santa Monica is defined by a "lifestyle tax" that extends beyond housing. While groceries are only 104.7% of the national average, the cost of maintaining a social and professional life is punishing. Restaurant prices are 114.8% of the US average, and transportation costs are elevated at 108.8%, largely due to local fuel prices and insurance rates.

Crucially, the energy sector presents a massive outlier. Electricity costs are recorded at 31.97 cents/kWh, which is 99.2% higher than the US average of 16.0 cents/kWh. For a household consuming 800 kWh monthly, this alone adds approximately $128 to the baseline budget compared to the national norm.

Category Single Person (Monthly) Family of 4 (Monthly) Index (US Avg = 100)
Housing (Rent) $2,601 (1BR) $4,500 (3BR) 145.0
Groceries $420 $1,250 104.7
Transportation $350 $850 108.8
Healthcare $380 $1,100 109.2
Restaurants/Ent. $550 $1,200 114.8
Utilities (Elec/Gas) $180 $320 131.9
TOTAL $4,481 $9,220 128.5

Disposable Income Analysis:
To achieve a "comfortable" disposable income threshold of $2,000 per month after taxes and essentials, a single renter needs a gross monthly income of approximately $7,500 ($90k annual). For a family renting a 3-bedroom, that requirement jumps to $14,000 gross monthly income ($168k annual).

💰 Cost of Living vs US Average

Santa Monica's prices compared to national average (100 = US Average)

Cheaper than US
More expensive

Source: BLS & BEA RPP (2025 Est.)

Housing Market Deep Dive

The housing market in Santa Monica is decoupled from national trends. The median home price is $2,100,000, which is 210% higher than the US average. The Price-to-Square-Foot ratio sits at $1,050, a metric that usually signals luxury markets but is the standard here.

The "Buy vs. Rent" analysis reveals a massive spread. The price-to-rent ratio is heavily skewed toward renting in the short term. With median rent for a 1-bedroom at $2,601 and median home ownership costs (mortgage + tax + insurance) exceeding $11,000 monthly, renting preserves liquidity. However, the 5-year appreciation forecast for Santa Monica real estate remains steady at 4.5% annually, outpacing inflation, making buying a long-term wealth preservation strategy rather than an immediate cost-saver.

Metric Santa Monica Value US Average Difference (%)
Median Home Price $2,100,000 $675,000 +210%
Price / Sq Ft $1,050 $350 +200%
Rent (1BR) $2,601 $1,700 +53%
Rent (3BR) $4,500 $2,500 +80%
Housing Index 145.0 100.0 +45%

Buying vs. Renting Verdict:
If your time horizon is less than 7 years, renting is financially superior. The transaction costs of buying (approx. 8–10% of value) negate equity gains in the short term. If you plan to stay 10+ years, buying becomes necessary to hedge against continued rent inflation, which has averaged 3.5% year-over-year.

🏠 Real Estate Market

$1.80M
Median Home Price
$1124
Per Sq Ft
99
Days on Market
Source: Redfin 2025 estimates

Economic & Job Market Outlook

The Return-to-Office (RTO) mandates of 2025 and 2026 have solidified Santa Monica's economic position. It is a primary hub for "Silicon Beach," hosting major ad-tech, gaming, and AI startups. Local industry stability is high, with a focus on high-wage sectors.

However, the commute is a critical variable. While 42% of residents work remotely full-time or hybrid, those commuting to downtown Los Angeles or the Westside tech corridor face significant friction. Average commute times are 28 minutes, but peak hour travel via the I-10 or surface streets can spike to 55 minutes.

Unemployment Analysis:
Santa Monica’s unemployment rate is 5.5%, which is 1.5 percentage points higher than the national average of 4.0%. This is a statistical anomaly often seen in affluent service economies where the labor force participation rate is high, but specialized job matching takes longer. It indicates a competitive labor market for mid-level roles.

Salary Wars

See how far your salary goes here vs other cities.

$75,000
US National Average
$75,000
Nominal Value
Real Value in Santa Monica
$64,935
-13.4% Purchasing Power

Purchasing Power Leaderboard

#1
Houston
$74,850
#2
Chicago
$73,099
#3
Phoenix
$71,090
#4
New York
$66,667
#5
Santa MonicaYou
$64,935

💰 Income Comparison

Quality of Life Audit

Santa Monica scores exceptionally well on health and environmental metrics, though the "High" property crime rate is a notable drag on safety scores. The city's Health Score of 86.1/100 is driven by low risk factors: obesity rates are 23.0% (vs 31.9% US) and smoking rates are 8.0% (vs 14.0% US).

Air quality remains a moderate concern. The AQI average is 80, categorized as "Moderate," largely due to marine layer trapping particulate matter and regional wildfire smoke drift. PM2.5 levels hover around 11.0 µg/m³, which is acceptable but exceeds the strict WHO guideline of 5.0 µg/m³.

Metric City Value US Average Rating
Health Score 86.1/100 75.0/100 Excellent
Obesity Rate 23.0% 31.9% Low
Diabetes Rate 8.7% 10.9% Low
Smoking Rate 8.0% 14.0% Low
Mental Health (Reported) 78% Good 65% Good High
AQI (Annual Avg) 80 55 Moderate
PM2.5 (µg/m³) 11.0 8.0 Moderate
Unemployment Rate 5.5% 4.0% High

Safety & Infrastructure:

  • Violent Crime: 500 per 100k (US Avg: 380). This is statistically Average, though higher than the national average.
  • Property Crime: 2,676 per 100k (US Avg: 2,000). This is 33.8% higher than the national average. Vehicle break-ins and retail theft are the primary drivers.
  • Schools: The Santa Monica-Malibu Unified School District (SMMUSD) is a major draw, with test scores roughly 15% above the state average.
  • Weather: Today’s conditions are clear with a high of 65°F and a low of 48°F. The climate offers an average of 285 sunny days per year, significantly reducing seasonal affective disorder risks.

Quality of Life Metrics

Air Quality

EPA Annual Average
Moderate
97AQI
Acceptable for most.
PM2.5 Concentration36.6 µg/m³

Health Pulse

CDC PLACES Data
86.1
Score
Obesity
23%
Low Avg (32%) High
Diabetes
8.7%
Smoking
8%
Based on CDC PLACES health census data. Higher score indicates better overall public health outcomes.

Safety Score

FBI Crime Data Estimate
Below Avg
Violent Crime
per 100k people
499.5
US Avg: 363.8
Property Crime
per 100k people
2677
US Avg: 1917
Crime rates are generally higher than the national average.

The Verdict

Pros:

  • Health & Wellness: The data confirms Santa Monica is one of the healthiest cities in America, with risk factors significantly below national averages.
  • Hybrid Economy: The city is perfectly architected for the hybrid worker who needs occasional access to a major tech hub but desires coastal living.
  • Income Potential: Local incomes are 46.8% higher, offering a ceiling for earnings that few other mid-sized cities can match.

Cons:

  • The Housing Anchor: A 145.0 Housing Index requires a massive income stream to live comfortably. It is a "high-burn" location.
  • Property Crime: The property crime rate of 2,676/100k is a tangible daily risk, specifically regarding vehicle security.
  • Energy Volatility: Electricity costs at 31.97 cents/kWh create unpredictable utility bills, particularly during heatwaves.

Final Recommendation:
Relocate to Santa Monica in 2026 only if your household income exceeds $150,000 and your work arrangement is hybrid (1–3 days in office). It is a premium lifestyle destination that monetizes health and weather. If you are fully remote, the data suggests you can find comparable quality of life in secondary markets (e.g., Sacramento or San Diego) for 40% less cost.

FAQs

1. What salary is required to live comfortably in Santa Monica?
For a single person, a gross annual income of $90,000 is the minimum threshold to cover rent ($2,601), utilities, and basic savings without debt. For a family, $168,000 is the baseline.

2. How does the value proposition compare to other coastal cities?
Santa Monica is 15–20% more expensive than San Diego and roughly 10% more expensive than Santa Barbara in terms of housing, but it offers higher income potential due to proximity to the Los Angeles tech and entertainment economy.

3. Are the safety statistics a major concern?
The Violent Crime rate of 500/100k is manageable and typical for a dense urban area. However, the Property Crime rate of 2,676/100k requires vigilance. You must account for comprehensive auto insurance and secure parking in your budget.

4. When is the best time to move to secure housing deals?
The rental market cools slightly between October and December. Average rent concessions during this period can equate to 1.5 months free on a 12-month lease, compared to the peak summer moving season.

Loading...