Tracked cities
582
snapshot universe

Ocity city-database snapshot - 2026-07-14
Among the 582 eligible OCity rows, Flint, Michigan has the lowest recorded median home-price-to-household-income ratio at 1.952x. The snapshot also reports one-bedroom rent context; it is a city-row screening comparison, not the NAR mortgage-qualification index or a personal affordability verdict.
Tracked cities
582
snapshot universe
Avg city PTI
5.99x
average of city-level ratios
Avg home price
$508,668
across tracked rows
Avg 1BR rent
$1,410/mo
screening input
PTI divides each city row's home price by its household income. It is a screening metric; it does not measure mortgage qualification, household wealth or a person's lived affordability.
Lowest snapshot PTI
1.952x
Home $64,700 - Income $33,141 - 1BR rent $854/mo
Highest snapshot PTI
25.410x
Home $3,975,000 - Income $156,434 - 1BR rent $2,252/mo
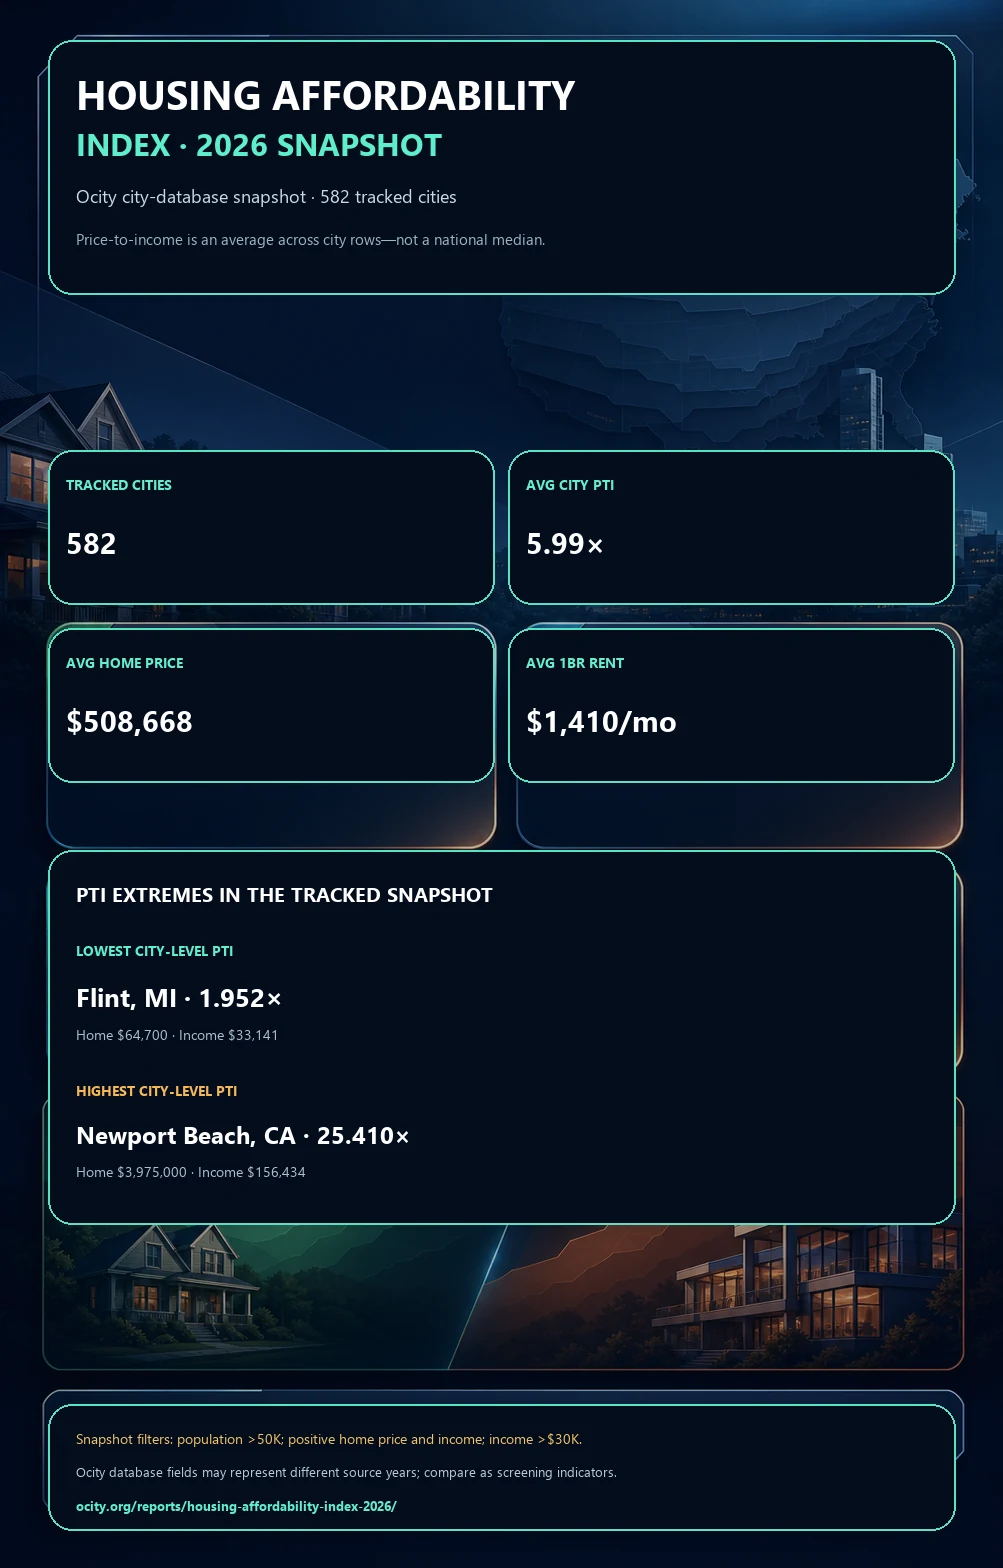
Population above 50,000; positive home price and income; income above $30,000.
| City | Home price | Income | PTI | 1BR rent |
|---|---|---|---|---|
| Flint, MI | $64,700 | $33,141 | 1.952x | $854 |
| Odessa, TX | $180,000 | $74,562 | 2.414x | $1,127 |
| Davenport, IA | $178,500 | $69,595 | 2.565x | $773 |
| Detroit, MI | $99,500 | $38,080 | 2.613x | $1,019 |
| Enid, OK | $170,000 | $63,472 | 2.678x | $760 |
| Lansing, MI | $155,000 | $55,197 | 2.808x | $887 |
| Plantation, FL | $272,500 | $95,965 | 2.840x | $1,621 |
| Cedar Rapids, IA | $192,250 | $66,720 | 2.881x | $716 |
| Moore, OK | $221,750 | $76,941 | 2.882x | $773 |
| St. Joseph, MO | $170,000 | $57,205 | 2.972x | $734 |
| Akron, OH | $151,000 | $50,025 | 3.018x | $816 |
| Rockford, IL | $180,000 | $59,451 | 3.028x | $785 |
| Springfield, IL | $194,500 | $63,849 | 3.046x | $873 |
| Ankeny, IA | $323,500 | $105,862 | 3.056x | $787 |
| Levittown CDP, PA | $311,000 | $101,619 | 3.060x | $1,190 |
Snapshot universe. Ocity city database; population > 50,000, positive median home price and median income, median income > $30,000. The headline PTI is an arithmetic average across city rows, not a national median. State comparisons should be treated as unweighted collections of tracked cities, not state estimates.
Rent screening. Annual one-bedroom rent divided by annual median income is not an observed household rent-burden estimate. Database fields can reflect different source years, so the snapshot is not one synchronized external release.
This report does not establish migration causes, policy effects, salary offsets, mortgage affordability or personal relocation savings.