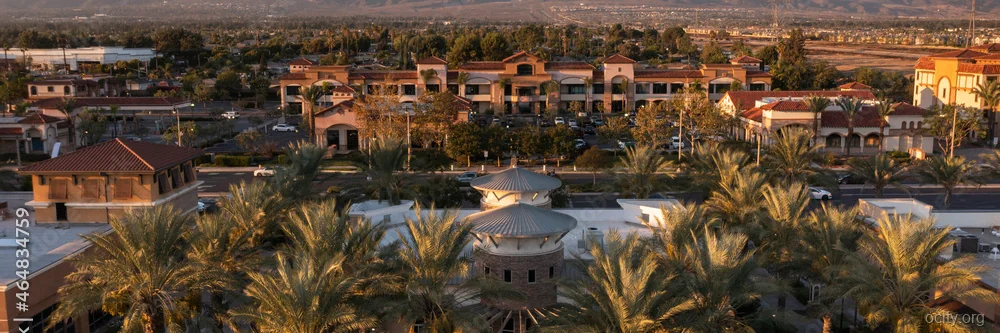
Rancho Cucamonga, CA
Housing Market Screening
City-level home-price and one-bedroom-rent references with transparent methodology and limitations.
City-level screening
Home price / annualized 1BR rent
Not cap rate, ROI, valuation or buy-versus-rent advice. City fields may reflect different source years.
Housing Screening Context
Rancho Cucamonga has a computed screening multiple of 29.8x and a gross annual 1BR-rent reference of 3.4%.
These values compare separate city-level fields, not one matched property. They exclude financing, taxes, insurance, maintenance, vacancy, transaction costs and tenure horizon.
Recorded year-over-year price change: -1.1%. Source period and forecast assumptions should be reviewed before scenario use.
Read the transparent methodology or open the Housing Research Hub.
Rental Cash Flow Analysis
Monthly Income
Est. Monthly Expenses
Price Forecast 2026–2028
🔮 Rancho Cucamonga Price Forecast 2026–2028
Looking at the Rancho Cucamonga housing market forecast for 2026-2028, the data suggests a period of consolidation rather than the rapid appreciation seen in prior years. The current median home price of $776,221 has seen a slight pullback with a -0.9% YoY change, a cooling signal after a robust 34.0% 5-year price surge. While the market remains relatively tight with homes spending only 27 days on the market, affordability constraints are becoming a defining characteristic of the Inland Empire landscape. The local economy, heavily tied to the Ontario logistics hub and regional healthcare, provides a stable employment floor, but high borrowing costs will likely temper buyer enthusiasm through 2027. This environment suggests that Rancho Cucamonga home prices will likely stabilize, with modest single-digit fluctuations rather than a dramatic crash or boom.
The central question for potential buyers is will Rancho Cucamonga home prices drop significantly? The answer lies in the extreme price-to-rent ratio of 27.3x, which is well above the national average and heavily favors renting over buying from a pure investment standpoint. With a "RENT" verdict and a market temperature cooling to 67/100, the incentive for speculative purchasing has diminished. However, the area's enduring appeal—top-rated schools, access to the 215 and 10 freeways, and a diverse economic base—provides a solid floor for values. Even as the 5-year CAGR settles around 5.9%, demand from families seeking suburban stability in Rancho Cucamonga real estate Rancho Cucamonga 2027 will likely prevent any sharp corrections, keeping the market steady but expensive.
Job Market
Healthcare
Risk Factors
Market Activity
Market Position
Similar Markets Compare with cities of similar size & cost
Santa Rosa
Elk Grove
Pembroke Pines
Eugene
Oceanside
Showing cities with similar population (87k - 262k) and cost of living index (86 - 129)
ROI Projector Model an editable scenario
Adjust the sliders to model different investment scenarios for Rancho Cucamonga.
* Estimates based on 0.0% annual appreciation, 3% rent growth, 5% vacancy. Does not include closing costs, tax benefits, or capital gains tax. For illustrative purposes only.
Rental Scenario Calculator Estimate your monthly cashflow
Rental Cash-Flow Scenario
Pre-filled for Rancho Cucamonga
Property
Financing
Expenses
Monthly Breakdown
Scenario Summary
Investor Toolkit
Research Rancho Cucamonga before you invest
10 Best Cities to Buy Rental Property in 2026 (ROI Data)
Where landlords earn the highest returns — rent-to-price ratios that actually make real estate investing work
real estate10 Best Affordable Suburbs in America (2026)
Suburban living without the suburban price tag — great schools, safe streets, low rent
real estateCan You Buy a House on $40K? These 10 Cities Make It Possible (2026)
Home ownership on a modest salary isn't dead — you just need to look in the right places
Disclaimer: This analysis is for informational purposes only and should not be considered financial advice. Investment decisions should be made after consulting with qualified professionals. Data sources include Zillow, Census Bureau, and BLS. Cap rates and yields are estimates based on available data.
Last updated: July 2026