Tracked cities
582
snapshot universe

Ocity city-database snapshot · 2026-07-14
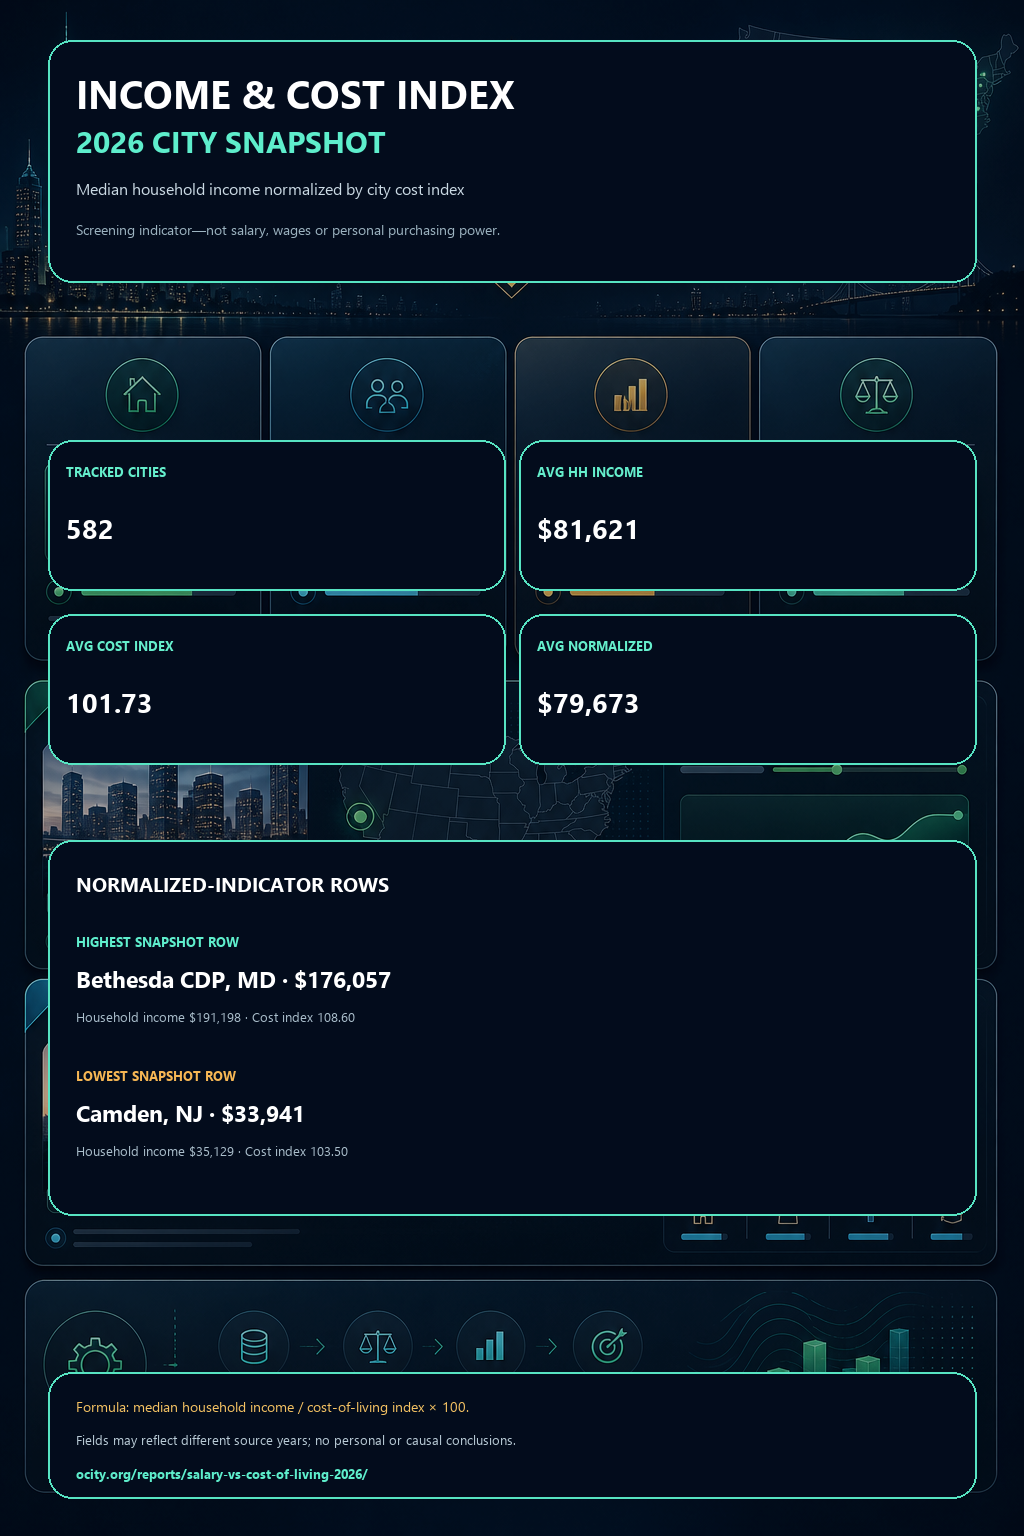
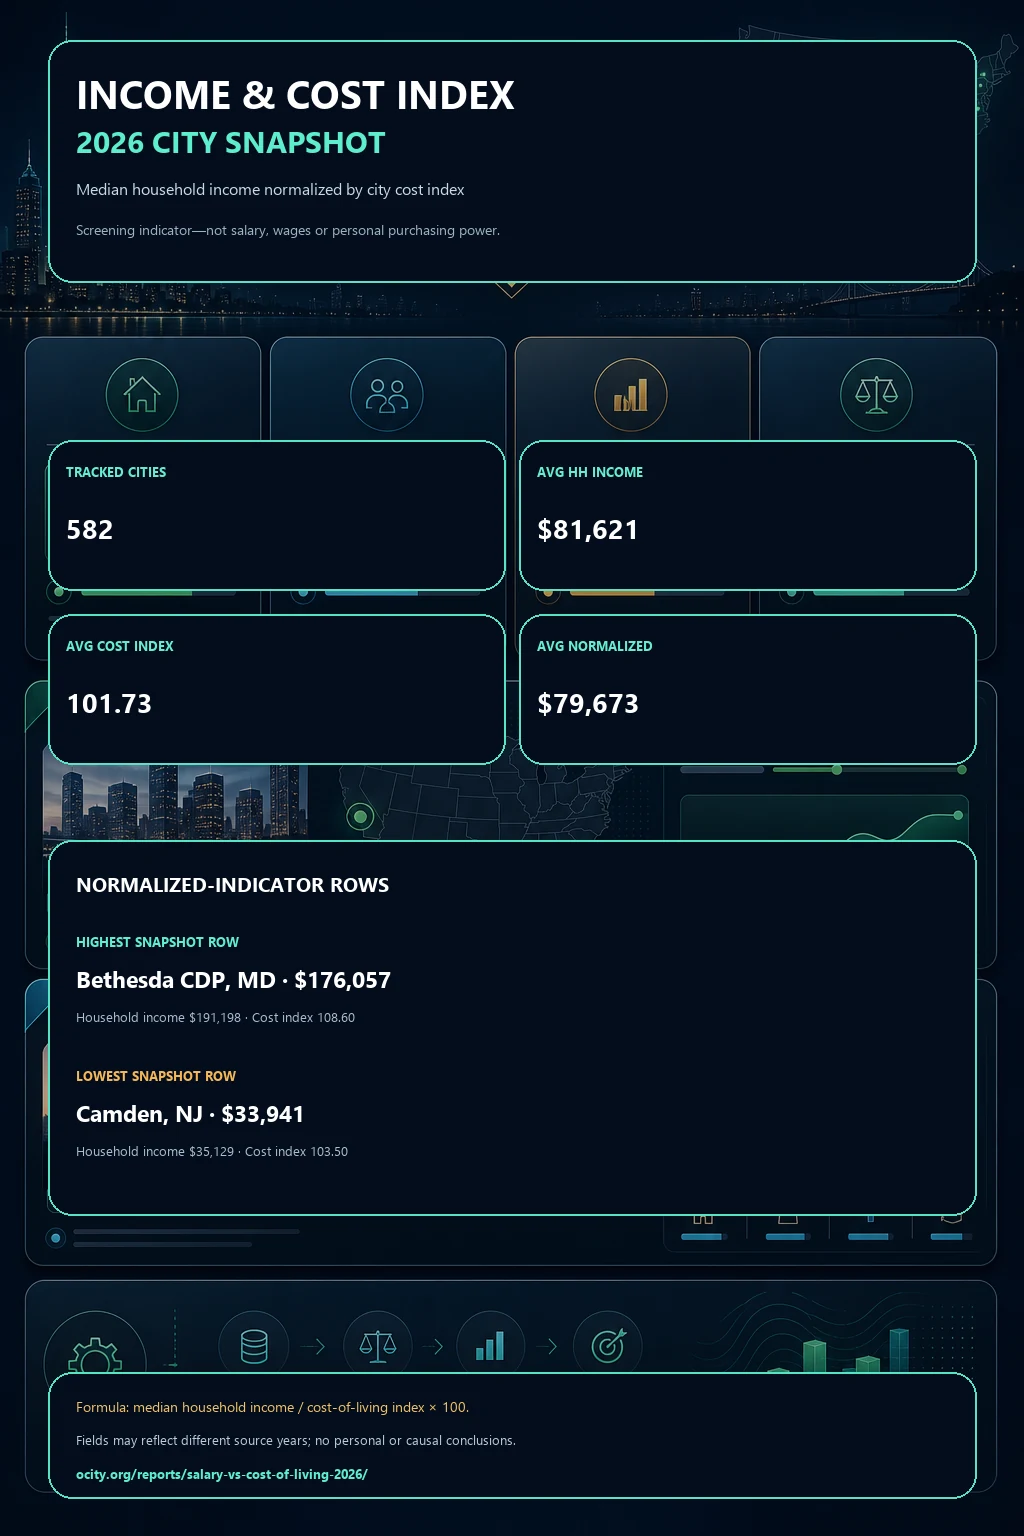
A transparent 582-city screening index that normalizes median household income by local cost index. It helps compare database rows—not job offers, wages, take-home pay or personal affordability.
Tracked cities
582
snapshot universe
Avg household income
$81,621
average city row
Avg cost index
101.73
average city row
Avg normalized indicator
$79,673
average city row
The screening transformation is median household income ÷ cost-of-living index × 100. It re-scales city rows against an index baseline of 100. It is not an inflation-adjusted measure, a salary conversion or an estimate of individual purchasing power.
Highest normalized snapshot row
$176,057
Household income $191,198 · Cost index 108.60
Lowest normalized snapshot row
$33,941
Household income $35,129 · Cost index 103.50
Included cities: population above 50,000, median household income above $30,000 and a positive cost index.
| City | Household income | Cost index | Normalized indicator | 1BR rent |
|---|---|---|---|---|
| Bethesda CDP, MD | $191,198 | 108.60 | $176,057 | $1,574 |
| Sunnyvale, CA | $189,443 | 112.90 | $167,797 | $2,694 |
| Newton, MA | $185,154 | 111.60 | $165,909 | $2,064 |
| San Ramon, CA | $195,491 | 118.20 | $165,390 | $2,304 |
| Mountain View, CA | $181,671 | 112.90 | $160,913 | $2,201 |
| Milpitas, CA | $179,727 | 112.90 | $159,191 | $2,201 |
| Redmond, WA | $172,979 | 113.00 | $153,079 | $1,864 |
| Carmel, IN | $143,676 | 94.60 | $151,877 | $1,145 |
| Johns Creek, GA | $151,344 | 100.90 | $149,994 | $1,362 |
| Naperville, IL | $152,181 | 102.60 | $148,325 | $1,507 |
| Santa Clara, CA | $166,228 | 112.90 | $147,235 | $2,694 |
| Ellicott City CDP, MD | $148,677 | 102.70 | $144,768 | $1,489 |
| Fremont, CA | $170,934 | 118.20 | $144,614 | $2,131 |
| East Honolulu CDP, HI | $158,398 | 110.20 | $143,737 | $2,038 |
| Flower Mound, TX | $147,490 | 103.30 | $142,778 | $1,291 |
What is measured. Ocity city database; population > 50,000, median household income > $30,000, positive cost-of-living index. The indicator normalizes median household income by a city cost index. Headline figures are averages across included city rows, not national economic estimates.
What is not measured. This does not estimate occupational wages, take-home pay, taxes, household composition, debt, benefits, homeownership or personal affordability. Database fields may represent different source years.
The index does not establish a raise, lifestyle outcome, remote-work effect, migration decision, purchasing-power outcome or causal cost effect.